阅读更多
1 Compile Process
flowchart TD
    other_target(["Other Object File"])
    linker[["Linker"]]
    source(["Source Code"])
    compiler[["Compiler"]]
    assembly(["Assembly Code"])
    assembler[["Assembler"]]
    target(["Object File"])
    lib(["Library File"])
    result_target(["Object File"])
    exec(["Executable File"])
    result_lib(["Library File"])

    other_target --> linker

    subgraph Compile Process
        source --> compiler
        compiler --> assembly
        assembly --> assembler
        assembler --> target
        end
        target --> linker
        lib --> linker

    linker --> result_target
    linker --> exec
    linker --> result_lib
2 Library
2.1 Header File Search Order
头文件#include "xxx.h"的搜索顺序
- 先搜索当前目录
- 然后搜索
-I参数指定的目录 - 再搜索gcc的环境变量
CPLUS_INCLUDE_PATH(C程序使用的是C_INCLUDE_PATH) - 最后搜索gcc的内定目录,包括:
/usr/include/usr/local/include/usr/lib/gcc/x86_64-redhat-linux/<gcc version>/include(C头文件)或者/usr/include/c++/<gcc version>(C++头文件)
头文件#include <xxx.h>的搜索顺序
- 先搜索
-I参数指定的目录 - 再搜索gcc的环境变量
CPLUS_INCLUDE_PATH(C程序使用的是C_INCLUDE_PATH) - 最后搜索gcc的内定目录,包括:
/usr/include/usr/local/include/usr/lib/gcc/x86_64-redhat-linux/<gcc version>/include(C头文件)或者/usr/include/c++/<gcc version>(C++头文件)
可以在编译的时候加上-v参数,就可以看到最准确的搜索路径
- 每个版本的编译器都有自己的头文件,这个路径应该是在构建编译器的时候写到二进制里面去的
gcc -v -c -xc++ /dev/nullclang -v -c -xc++ /dev/null
2.2 Static Library
后缀:*.a
编译时如何链接静态链接库:
-L:指定静态链接库的搜索路径-l <static_lib_name>:- 假设静态链接库的名称是
libgflags.a,那么<static_lib_name>既不需要lib前缀,也不需要.a后缀,即gflags
- 假设静态链接库的名称是
如何查看二进制的静态链接库:由于链接器在链接时,就会丢弃静态库的名字信息,因此,一般是看不到的
-Xlinker -Map=a.map:将链接时的信息记录到a.map中nm/objdump/readelf/strings或许可以找到一些静态库相关的hint
2.3 Dynamic Library
后缀:*.so
如何查看二进制的动态链接库:ldd (list dynamic dependencies)
查看动态链接库绑定信息:ldconfig -v、ldconfig -p
- 安装新的库后,需要
sudo ldconfig更新缓存,否则运行时可能会找不到对应的so文件
2.3.1 Linux’s so version mechanism
本小节转载摘录自一文读懂Linux下动态链接库版本管理及查找加载方式
在/lib64、/usr/lib64、/usr/local/lib64目录下,会看到很多具有下列特征的软连接,其中x、y、z为数字, 那么这些软连接和他们后面的数字有什么用途呢?
1 | libfoo.so -> libfoo.so.x |
这里的x、y、z分别代表的是这个so的主版本号(MAJOR),次版本号(MINOR),以及发行版本号(RELEASE),对于这三个数字各自的含义,以及什么时候会进行增长,不同的文献上有不同的解释,不同的组织遵循的规定可能也有细微的差别,但有一个可以肯定的事情是:主版本号(MAJOR)不同的两个so库,所暴露出的API接口是不兼容的。而对于次版本号,和发行版本号,则有着不同定义,其中一种定义是:次要版本号表示API接口的定义发生了改变(比如参数的含义发生了变化),但是保持向前兼容;而发行版本号则是函数内部的一些功能调整、优化、BUG修复,不涉及API接口定义的修改
2.3.1.1 so Related Names
介绍一下在so查找过程中的几个名字
SONAME:一组具有兼容API的so库所共有的名字,其命名特征是lib<库名>.so.<数字>这种形式的real name:是真实具有so库可执行代码的那个文件,之所以叫real是相对于SONAME和linker name而言的,因为另外两种名字一般都是一个软连接,这些软连接最终指向的文件都是具有real name命名形式的文件。real name的命名格式中,可能有2个数字尾缀,也可能有3个数字尾缀,但这不重要。你只要记住,真实的那个,不是以软连接形式存在的,就是一个real namelinker name:这个名字只是给编译工具链中的连接器使用的名字,和程序运行并没有什么关系,仅仅在链接得到可执行文件的过程中才会用到。它的命名特征是以lib开头,以.so结尾,不带任何数字后缀的格式
2.3.1.2 SONAME
假设在你的Linux系统中有3个不同版本的bar共享库,他们在磁盘上保存的文件名如下:
/usr/lib64/libbar.so.1.3/usr/lib64/libbar.so.1.5/usr/lib64/libbar.so.2.1
假设以上三个文件,都是真实的so库文件,而不是软连接,也就是说,上面列出的名字都是real name
根据我们之前对版本号的定义,我们可以知道:
libbar.so.1.3和libbar.so.1.5之间是互相兼容的libbar.so.2.1和上述两个库之间互相不兼容
引入软连接的好处是什么呢?假设有一天,libbar.so.2.1库进行了升级,但API接口仍然保持兼容,升级后的库文件为libbar.so.2.2,这时候,我们只要将之前的软连接重新指向升级后的文件,然后重新启动B程序,B程序就可以使用全新版本的so库了,我们并不需要去重新编译链接来更新B程序
总结一下上面的逻辑:
- 通常
SONAME是一个指向real name的软连接 - 应用程序中存储自己所依赖的
so库的SONAME,也就是仅保证主版本号能匹配就行 - 通过修改软连接的指向,可以让应用程序在互相兼容的
so库中方便切换使用哪一个 - 通常情况下,大家使用最新版本即可,除非是为了在特定版本下做一些调试、开发工作
2.3.1.3 linker name
上一节中我们提到,可执行文件里会存储精确到主版本号的SONAME,但是在编译生成可执行文件的过程中,编译器怎么知道应该用哪个主版本号呢?为了回答这个问题,我们从编译链接的过程来梳理一下
假设我们使用gcc编译生成一个依赖foo库的可执行文件A:gcc A.c -lfoo -o A
熟悉gcc编译的读者们肯定知道,上述的-l标记后跟随了foo参数,表示我们告诉gcc在编译的过程中需要用到一个外部的名为foo的库,但这里有一个问题,我们并没有说使用哪一个主版本,我们只给出了一个名字。为了解决这个问题,软链接再次发挥作用,具体流程如下:
根据linux下动态链接库的命名规范,gcc会根据-lfoo这个标识拼接出libfoo.so这个文件名,这个文件名就是linker name,然后去尝试读取这个文件,并将这个库链接到生成的可执行文件A中。在执行编译前,我们可以通过软链接的形式,将libfoo.so指向一个具体so库,也就是指向一个real name,在编译过程中,gcc会从这个真实的库中读取出SONAME并将它写入到生成的可执行文件A中。例如,若libfoo.so指向libfoo.so.1.5,则生成的可执行文件A使用主版本号为1的SONAME,即libfoo.so.1
在上述编译过程完成之后,SONAME已经被写入可执行文件A中了,因此可以看到linker name仅仅在编译的过程中,可以起到指定连接那个库版本的作用,除此之外,再无其他作用
总结一下上面的逻辑:
- 通常
linker name是一个指向real name的软连接 - 通过修改软连接的指向,可以指定编译生成的可执行文件使用那个主版本号
so库 - 编译器从软链接指向的文件里找到其
SONAME,并将SONAME写入到生成的可执行文件中 - 通过改变
linker name软连接的指向,可以将不同主版本号的SONAME写入到生成的可执行文件中
2.4 Search Order
2.4.1 Compilation Time
During compilation, the order in which the linker (such as GNU’s ld) searches for library files follows certain rules, ensuring that the linker can find and link the correct version of the library. The search order typically goes as follows:
- Library files specified directly in the command line: If the compilation command directly specifies the full path to the library files, the linker will first use these specified paths. For example,
gcc main.c /path/to/libmylibrary.awill link directly to the library at the specified path. - Directories specified with the
-Loption: The compilation command can include the-Loption to add additional library search directories. The linker searches for library files in these directories in the order that the-Loptions appear. For example,gcc main.c -L/path/to/libs -lmylibraryinstructs the linker to search for a library namedlibmylibraryin/path/to/libs. - The
LIBRARY_PATHenvironment variable: If theLIBRARY_PATHenvironment variable is set, the linker also searches for library files in the directories specified by this variable. This environment variable can contain multiple directories and is commonly used to add search paths for non-standard libraries during compilation. - System default library search paths: If the linker does not find the library files in the paths specified above, it will turn to the system default library search paths. These default paths typically include standard library directories such as
/liband/usr/lib, as well as architecture-specific directories (e.g.,/lib/x86_64-linux-gnuor/usr/lib/x86_64-linux-gnu).- Refer to
ld --verbose | grep SEARCH_DIRfor details
- Refer to
The final value of LIBRARY_PATH(gcc -v can see the actual value) may not necessarily be just the value you set due to several reasons:
- Combination with Default and Built-in Paths: GCC and the linker (
ld) combine theLIBRARY_PATHyou set with a set of default and built-in paths. These built-in paths are determined by the GCC’s configuration during its installation and are intended to ensure that the compiler and linker can find standard libraries and headers necessary for compilation and linking, even if they are not in standard locations. - Augmentation by GCC: GCC might automatically augment
LIBRARY_PATHwith additional paths based on its internal logic or other environment variables. For instance, GCC might add paths related to its internal libraries or the target architecture’s standard library locations. - Security Restrictions: In some secure or restricted environments, modifications to environment variables like
LIBRARY_PATHmay be ignored or overridden by security policies. This is often seen in managed or shared computing environments where administrators want to control the software linking process strictly.
2.4.2 Runtime
The runtime search order for shared libraries (.so files) on Unix-like systems is determined by several factors and environment settings. Here’s a general overview of how the runtime search order works: (Refer to man ld.so for details)
RPATHandRUNPATH: When a binary is compiled, it can be linked with shared libraries using-rpathor-runpathlinker options. These options embed paths directly into the binary where the dynamic linker (ld.soor similar) should look for shared libraries.RPATHis checked first, but ifRUNPATHis also specified, it takes precedence overRPATHwhen the dynamic linker is configured to useDT_RUNPATHentries (a newer feature).- How to check the runpath of a binary:
readelf -d <binary> | grep 'RPATH\|RUNPATH'
- How to check the runpath of a binary:
LD_LIBRARY_PATHEnvironment Variable: Before falling back to default system paths, the dynamic linker checks the directories listed in theLD_LIBRARY_PATHenvironment variable, if it is set. This allows users to override the system’s default library paths or the paths embedded in the binary. However, for security reasons, this variable is ignored for setuid/setgid executables.- Default System Library Paths: If the library is not found in any of the previously mentioned locations, the linker searches the default library paths. These typically include
/lib,/usr/lib, and their architecture-specific counterparts (e.g.,/lib/x86_64-linux-gnuon some Linux distributions). The exact default paths can vary between systems and are defined in the dynamic linker’s configuration file (usually/etc/ld.so.conf), which can include additional directories beyond the standard ones. - DT_RPATH and DT_RUNPATH of Used Libraries (Dependencies): If the shared library being loaded has dependencies on other shared libraries, the dynamic linker also searches the
RPATHandRUNPATHof those dependencies. This step ensures that all nested dependencies are resolved correctly. /etc/ld.so.cache: This is a compiled list of candidate libraries previously found in the configured system library paths. The dynamic linker uses this cache to speed up the lookup process. The cache can be updated with theldconfigcommand, which scans the directories in/etc/ld.so.confand the standard directories for libraries, then builds the cache file.- Built-in System Paths: Finally, if the library still hasn’t been found, the linker falls back to built-in system paths hardcoded into the dynamic linker. This usually includes the standard directories like
/liband/usr/lib.
2.4.2.1 How to update /etc/ld.so.cache
Adding content directly to /etc/ld.so.cache is not recommended because it’s a binary file generated by the ldconfig tool. Modifying it manually can lead to system instability or even make your system unbootable. The correct way to add new libraries to the cache involves placing the library files in a directory that is scanned by ldconfig and then running ldconfig to update the cache.
Here’s how you can add a new library to the system and update /etc/ld.so.cache:
Place the Library in a Standard Directory
First, you need to place your library files (.so files) in a standard directory that is recognized by the dynamic linker. Common directories include:
/lib/usr/lib- For system-wide libraries not provided by the package manager.
Or you can use a custom directory, but you’ll need to tell ldconfig about it, as described below.
(Optional) Add a Custom Directory to the ld.so Configuration
If you’re using a custom directory (/custom/lib for example), you need to add it to the dynamic linker’s configuration. Do this by creating a new file in /etc/ld.so.conf.d/:
Create /etc/ld.so.conf.d/mylibs.conf, Add the path to your custom library directory in this file:
1 | /custom/lib |
Update the Cache
After placing your libraries in the appropriate directory and configuring any custom paths, you need to update /etc/ld.so.cache by running ldconfig. This step requires root privileges:
1 | sudo ldconfig |
This command scans the directories listed in /etc/ld.so.conf, its *.conf includes in /etc/ld.so.conf.d/, and the default directories (/lib, /usr/lib). It then updates /etc/ld.so.cache with the paths to the available libraries.
Check
1 | ldconfig -p | grep /custom/lib |
All-in-one Command
1 | echo '/custom/lib' | sudo tee /etc/ld.so.conf.d/mylibs.conf && sudo ldconfig |
2.5 Link Order
Why does the order in which libraries are linked sometimes cause errors in GCC?
2.5.1 Static Linking
In static linking, the order in which libraries are linked can be very important. This is because the linker, which resolves symbols and references in your code, processes libraries in the order they are specified. If one library depends on symbols from another, the dependent library must be listed first. This order dependency ensures that all symbols are resolved correctly at the time of linking, and the final executable contains all necessary code.
Here’s the description of the link process:
- Scan Object Files and Libraries: The linker scans the object files and libraries in the order they are specified on the command line from left to right. This order is crucial because it can determine which definitions of symbols are used when multiple definitions are present.
- Record Symbols: As the linker scans, it builds tables of symbols. It distinguishes between undefined symbols (those referenced but not defined in the scanned files) and defined symbols (those that have definitions in the scanned files).
- Resolve Symbols: When the linker encounters an undefined symbol, it looks for a definition of that symbol in the subsequent files and libraries. If a library is found that resolves an undefined symbol, the linker links that library’s code to satisfy the symbol reference. Libraries are not fully linked unless they contain symbols that resolve undefined references.
- Remove Resolved Symbols from Unresolved Symbols Table: Once a symbol is resolved, it is removed from the unresolved symbols table. If there are any unresolved symbols after all files and libraries have been processed, the linker typically throws an error indicating unresolved symbols.
Example:
1 | cat > a.cpp << 'EOF' |
2.5.2 Dynamic Linking
In dynamic linking, the order of linking libraries is typically less critical. Libraries are not combined into a single executable at compile time; instead, references to these libraries are resolved at runtime. The dynamic linker/loader handles the process of loading the necessary libraries into memory when the program is executed and resolves symbols on the fly. This means that the system can usually manage dependencies more flexibly, and the specific order in which libraries are listed is not as crucial.
2.6 Environment Variables
Please refer to man ld.so for details:
2.6.1 LD_PRELOAD
Lists shared libraries that are loaded (preloaded) before any other shared libraries. This can be used to override functions in other shared objects.
1 | cat > sample.c << 'EOF' |
2.6.2 LD_DEBUG
Usage: LD_DEBUG=<type> <binary>, here are all available types.
all: Print all debugging information (except statistics and unused; see below).bindings: Display information about which definition each symbol is bound to.files: Display progress for input file.libs: Display library search paths.reloc: Display relocation processing.scopes: Display scope information.statistics: Display relocation statistics.symbols: Display search paths for each symbol look-up.unused: Determine unused DSOs.versions: Display version dependencies.
2.7 How to make library
2.7.1 How to make static library
1 | cat > foo.cpp << 'EOF' |
2.7.2 How to make dynamic library
1 | cat > foo.cpp << 'EOF' |
2.8 ABI
ABI全称是Application Binary Interface,它是两个二进制模块间的接口,二进制模块可以是lib,可以是操作系统的基础设施,或者一个正在运行的用户程序
An ABI defines how data structures or computational routines are accessed in machine code, which is a low-level, hardware-dependent format
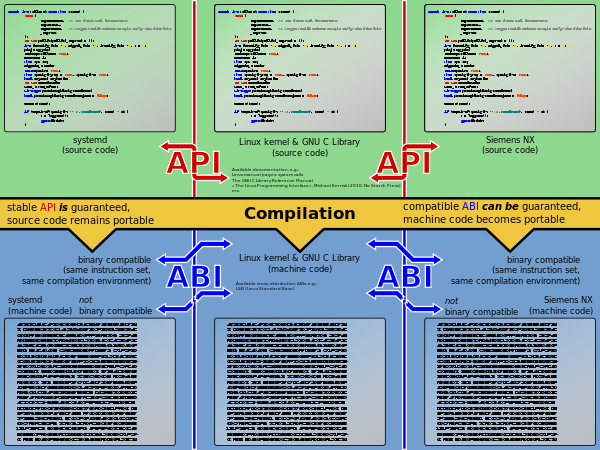
具体来说,ABI定义了如下内容:
- 指令集、寄存器、栈组织结构,内存访问类型等等
- 基本数据类型的
size、layout、alignment - 调用约定,比如参数如何传递、结果如何传递
- 参数传递到栈中,还是传递到寄存器中
- 如果传递到寄存器中的话,哪个入参对应哪个寄存器
- 如果传递到栈中的话,第一个入参是先压栈还是后压栈
- 返回值使用哪个寄存器
- 如何发起系统调用
lib、object file等的文件格式
2.8.1 cxxabi.h
Some commonly used functions for handling C++ ABI (Application Binary Interface), defined in <cxxabi.h>, include(The prefix __cxa stands for C++ eXception ABI):
abi::__cxa_demangle: Used to demangle symbol names generated by the C++ compiler into a human-readable form. This is useful in debugging and symbol resolution as compilers often mangle function names to distinguish different function overloads, template instantiations, etc.abi::__cxa_throw: Used to throw exceptions in C++ exception handling. It’s typically called within atry-catchblock’sthrowstatement to throw an exception object of a specific type.abi::__cxa_allocate_exception: Used to allocate memory for an exception object. It takes the size of the exception object as a parameter and returns a pointer to the allocated memory.abi::__cxa_current_exception_type: Used to retrieve type information for the current exception. It returns a pointer to astd::type_infoobject that describes the type of the current thrown exception.abi::__cxa_bad_cast: Used to throw astd::bad_castexception when adynamic_castfails. It’s typically called when a runtime type conversion fails.
2.8.2 Language-Specific ABI
Often, a platform will specify a “base ABI” that specifies how to use that platform’s basic services and that is often done in terms of C language capabilities. However, other programming languages like C++ may require support for additional mechanisms. That’s how you get to language-specific ABIs, including a variety of C++ ABIs. Among the concerns of a C++ ABI are the following:
- How are classes with virtual functions represented? A C++ ABI will just about always extend the C layout rules for this, and specify implicit pointers in the objects that point to static tables (“vtables”) that themselves point to virtual functions.
- How are base classes (including virtual base classes) laid out in class objects? Again, this usually starts with the C struct layout rules.
- How are closure classes (for lambdas) organized?
- How is RTTI information stored?
- How are exceptions implemented?
- How are overloaded functions and operators “named” in object files? This is where “name mangling” usually comes in: The type of the various functions is encoded in their object file names. That also handles the “overloading” that results from template instantiations.
- How are spilled inline functions and template instantiations handled? After all, different object files might use/spill the same instances, which could lead to collisions.
2.8.3 Dual ABI
In the GCC 5.1 release libstdc++ introduced a new library ABI that includes new implementations of std::string and std::list. These changes were necessary to conform to the 2011 C++ standard which forbids Copy-On-Write strings and requires lists to keep track of their size.
宏_GLIBCXX_USE_CXX11_ABI用于控制使用新版本还是老版本
_GLIBCXX_USE_CXX11_ABI = 0:老版本_GLIBCXX_USE_CXX11_ABI = 1:新版本
其他参考:
2.8.4 ABI Mismatch Example
Backgrounds: std::string underwent significant changes between the old and new ABI versions.
1 | cat > library.cpp << 'EOF' |
Why need extern "C"? You’ll get compile error if ABI mismatch when removing this.
1 | cat > library.cpp << 'EOF' |
2.8.5 ABI Mismatch Issue
1 | # compile works fine |
The errors you’re encountering at runtime indicate that your application (main) is linked against newer versions of the C++ standard library (libstdc++) and C++ ABI (CXXABI) than are available on your system. This typically happens when your application is compiled with a newer version of GCC than the one installed on the runtime system.
gcc -o main main.cpp -O0 -lstdc++ -fuse-ld=gold -Wl,--verbose: Check the dynamic lib path that used at link time.ldd main: Check the dynamic lib path that used at runtime.
2.9 Commonly-used Librarys
Library Interfaces and Headers
2.9.1 libc/glibc/glib
You can refer to man libc/glibc for details
libc实现了C的标准库函数,例如strcpy(),以及POSIX函数,例如系统调用getpid()。此外,不是所有的C标准库函数都包含在libc中,比如大多数math相关的库函数都封装在libm中,大多数压缩相关的库函数都封装在libz中- 系统调用有别于普通函数,它无法被链接器解析。实现系统调用必须引入平台相关的汇编指令。我们可以通过手动实现这些汇编指令来完成系统调用,或者直接使用
libc(它已经为我们封装好了)
- 系统调用有别于普通函数,它无法被链接器解析。实现系统调用必须引入平台相关的汇编指令。我们可以通过手动实现这些汇编指令来完成系统调用,或者直接使用
glibc, GNU C Library可以看做是libc的另一种实现,它不仅包含libc的所有功能还包含libm以及其他核心库,比如libpthreadglibc对应的动态库的名字是libc.so- Linux主流的发行版用的都是这个
- The GNU C Library (glibc)
glib是Linux下C的一些工具库,和glibc没有关系
查看glibc的版本
ldd --version:ldd隶属于glibc,因此ldd的版本就是glibc的版本getconf GNU_LIBC_VERSIONgcc -print-file-name=libc.sostrings /lib64/libc.so.6 | grep GLIBC:查看glibc的API的版本
2.9.2 libdl
The libdl library plays a crucial role in the Linux environment as it provides dynamic linking capabilities. Here’s a breakdown of its primary functions:
- Loading of Shared Libraries:
libdlenables the dynamic loading of shared libraries into memory during the runtime of an application. This is done without these libraries being statically linked to the executable, allowing for a more flexible and modular approach to application development and deployment. - Symbol Resolution: Once a shared library is loaded,
libdlprovides functions to look up symbols (functions and variables) within these libraries. This allows an application to call functions whose addresses are only known at runtime, facilitating the use of plugins or modules that can extend the application’s capabilities without needing to recompile the application. - Dynamic Unloading: It also supports the unloading of shared libraries from memory. This is useful for applications that need to load and unload modules dynamically based on runtime conditions, optimizing memory usage and functionality on the fly.
The primary functions provided by libdl include:
dlopen(): Opens a shared library and prepares it for use.dlsym(): Searches for the address of a symbol in the opened libraries.dlclose(): Closes a shared library, releasing resources associated with it.dlerror(): Provides string descriptions of errors caused by any of the above functions.
Supplemental Insights:
- dlopen in libc and libdl:
libdlis only exposing the private dl functions that already exist in libc as well as some wrappers to make the use of the libraries a bit easier. You can see some of this behaviour by looking at the symbol table oflibdl.- Check private methods:
readelf -s /lib64/ld-linux-x86-64.so.2 | grep PRIVATE
- Check private methods:
2.9.3 Others
libm:c math librarylibz:compression/decompression librarylibpthread:POSIX threads library
2.10 Reference
- Program Library HOWTO
- Shared Libraries: Understanding Dynamic Loading
- wiki-Rpath
- RPATH handling
- Linux hook:Ring3下动态链接库.so函数劫持
- What is the difference between LD_PRELOAD_PATH and LD_LIBRARY_PATH?
- What is libstdc++.so.6 and GLIBCXX_3.4.20?
- 多个gcc/glibc版本的共存及指定gcc版本的编译
3 Memory Management
Virtual memory is allocated through system call brk and mmap, please refer to Linux-Memory-Management for details.
memory management libraries run in user mode and typically use low-level system calls for virtual memory allocation. Different libraries may employ different memory allocation algorithms to effectively manage allocated and deallocated memory blocks in the heap.
3.1 tcmalloc
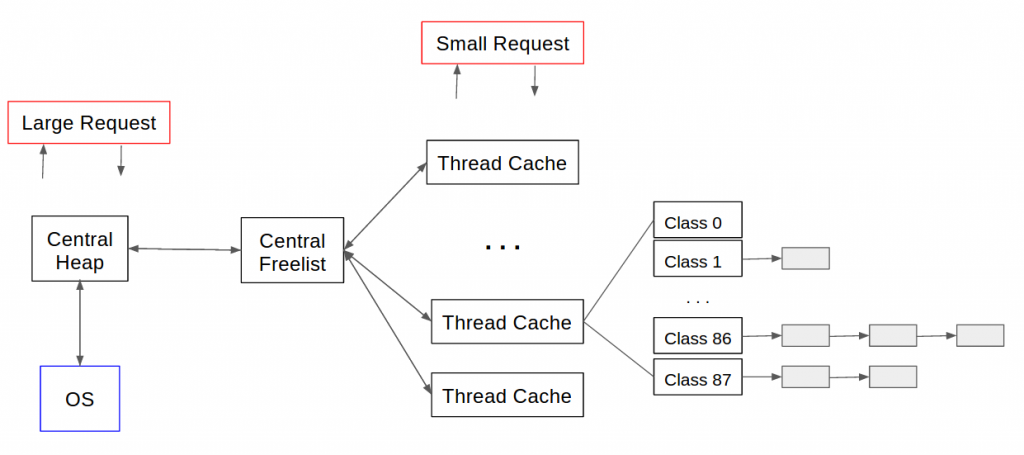
特点:
Small object allocation- 每个线程都会有个
ThreadCache,用于为当前线程分配小对象 - 当其容量不足时,会从
CentralCache获取额外的存储空间
- 每个线程都会有个
CentralCache allocation management- 用于分配大对象,大对象通常指
>32K - 当内存空间用完后,用
sbrk/mmap从操作系统中分配内存 - 在多线程高并发的场景中,
CentralCache中的锁竞争很容易成为瓶颈
- 用于分配大对象,大对象通常指
Recycle
Install:
1 | yum -y install gperftools gperftools-devel |
3.1.1 Heap-profile
main.cpp:
1 |
|
编译:
1 | gcc -o main main.cpp -Wall -O3 -lstdc++ -ltcmalloc -std=gnu++17 |
运行:
1 | # 开启 heap profile 功能 |
输出如下:
1 | Starting tracking the heap |
使用pprof分析内存:
1 | # 文本格式 |
3.2 jemalloc
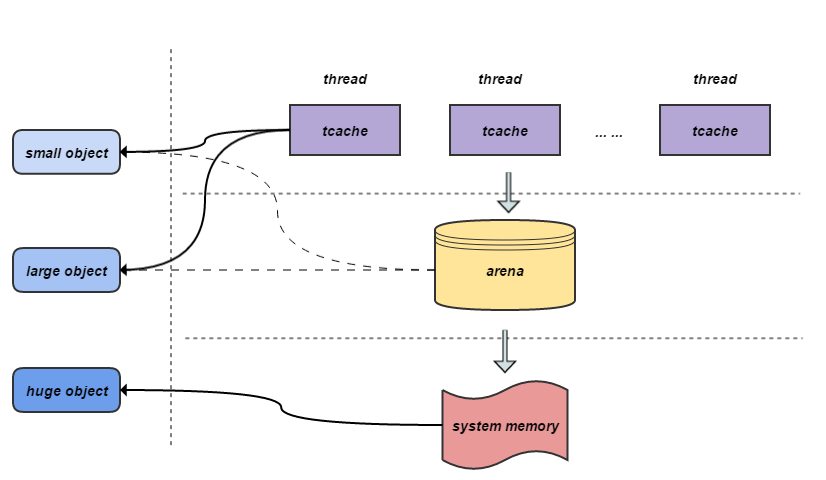
特点:
- 在多核、多线程场景下,跨线程分配/释放的性能比较好
- 大量分配小对象时,所占空间会比
tcmalloc稍多一些 - 对于大对象分配,所造成的的内存碎片会比
tcmalloc少一些 - 内存分类粒度更细,锁比
tcmalloc更少
3.2.1 Memory Stats
Key Metrics:
Allocated Memory (allocated):- Meaning: The total amount of memory currently allocated by the application.
- Usage: This is the memory actively used by your application. Monitoring this helps you understand how much memory your application is consuming at any given time.
Active Memory (active):- Meaning: The total amount of memory that is currently in use by the allocator for allocations. This includes both allocated memory and any internal fragmentation.
- Usage: Helps gauge the memory overhead introduced by internal fragmentation and allocation strategies.
Metadata (metadata):- Meaning: The memory used internally by jemalloc for bookkeeping and managing the heap.
- Usage: Understanding this helps in recognizing the overhead caused by the allocator itself. This includes data structures jemalloc uses to manage free and allocated memory blocks.
Resident Memory (resident):- Meaning: The total amount of memory currently mapped into the process’s address space.
- Usage: This metric provides insight into the actual physical memory usage of your application, including any memory mapped but not currently in active use.
Mapped Memory (mapped):- Meaning: The total amount of memory mapped from the operating system.
- Usage: This shows the total virtual memory footprint of your application, which includes all allocated, active, and metadata memory.
Retained Memory (retained):- Meaning: Memory that was allocated and later freed, but is being held by jemalloc for future allocations.
- Usage: Helps in understanding how much memory is being kept in reserve by the allocator for potential future use, which can be significant in applications with fluctuating memory requirements.
Detailed Analysis:
Internal Fragmentation: The difference between allocated and active memory. High internal fragmentation means that there is significant overhead due to the way memory is being managed and allocated.Allocator Overhead: The difference between active and allocated plus metadata. This helps in understanding how much additional memory jemalloc needs to manage your allocations.Virtual Memory Overhead: The difference between mapped and resident memory. This shows how much memory is being reserved in the virtual address space but not necessarily backed by physical memory.
3.2.2 Install
1 | git clone https://github.com/jemalloc/jemalloc.git |
3.2.3 Heap-profile
1 |
|
编译执行:
1 | gcc -o main main.cpp -O0 -lstdc++ -std=gnu++17 -L`jemalloc-config --libdir` -Wl,-rpath,`jemalloc-config --libdir` -ljemalloc `jemalloc-config --libs` |
查看:jeprof --text main <heap_file>
- 第一列:函数直接申请的内存大小,单位MB
- 第二列:第一列占总内存的百分比
- 第三列:第二列的累积值
- 第四列:函数以及函数所有调用的函数申请的内存大小,单位MB
- 第五列:第四列占总内存的百分比
1 | Using local file main. |
生成svg:
sudo apt install -y graphvizorsudo yum install -y graphvizjeprof --show_bytes --svg main <heap_file> > <svg_file>
3.2.4 Work with http
源码如下:
- yhirose/cpp-httplib
path是固定,即/pprof/heap以及/pprof/profile/pprof/profile的实现估计有问题,拿不到预期的结果
1 | sudo apt-get install libgoogle-perftools-dev |
1 |
|
Compile and run:
1 | gcc -o main main.cpp -O0 -lstdc++ -std=gnu++17 -L`jemalloc-config --libdir` -Wl,-rpath,`jemalloc-config --libdir` -ljemalloc `jemalloc-config --libs` -lprofiler |
How to create a graph:
1 | curl http://127.0.0.1:16691/pprof/heap > begin.heap |
3.2.5 Reference
3.3 mimalloc
3.4 Comparison
tcmalloc and jemalloc are both memory allocators, and they are commonly used in software development to manage dynamic memory allocation in programs. However, they have different characteristics and were designed to address different issues. Here’s a comparison of the two:
- Design Philosophy:
- jemalloc: Designed by Jason Evans, originally to enhance the performance of FreeBSD. jemalloc focuses on reducing memory fragmentation and improving memory allocation efficiency, especially in concurrent environments. It employs an advanced memory allocation strategy that reduces lock contention, thus improving performance in multithreaded applications.
- tcmalloc: Developed by Google, standing for “Thread-Caching Malloc”. The key feature of tcmalloc is that it provides individual memory caches for each thread. This design reduces the reliance on a global memory allocation lock, thus offering better performance in multithreaded applications.
- Memory Allocation Strategy:
- jemalloc: Uses size classes to manage memory allocations, which helps in reducing memory fragmentation. It also employs a delayed recycling strategy to further optimize memory usage.
- tcmalloc: Manages memory allocations for each thread through Thread Local Storage (TLS), meaning each thread has its own small memory pool for quick allocation and deallocation.
- Memory Fragmentation Management:
- jemalloc: Effectively reduces memory fragmentation through its sophisticated memory allocation strategy.
- tcmalloc: While its thread caching mechanism can boost performance, it might lead to more memory fragmentation in some scenarios.
- Suitable Use Cases:
- jemalloc: Widely used in applications requiring high-performance memory management, such as databases and large multithreaded applications.
- tcmalloc: Particularly suitable for applications that frequently allocate and deallocate memory due to its high-performance thread caching feature.
3.5 Hook
3.5.1 Override the operator new
1 |
|
1 | gcc -o main main.cpp -Wl,-wrap=malloc -lstdc++ -std=gnu++17 |
3.5.2 Wrap operator new by its mangled name
The mangled name for operator new with a size_t argument is _Znwm.
1 |
|
1 | gcc -o main main.cpp -Wl,-wrap=malloc -Wl,-wrap=_Znwm -lstdc++ -std=gnu++17 |
3.5.3 Work With Library
foo.cpp is like this:
1 |
|
main.cpp is like this:
1 |
|
3.5.3.1 Static Linking Library(Working)
And here are how to build the program.
1 | gcc -o foo.o -c foo.cpp -O3 -Wall -fPIC |
And it prints:
1 | hello, this is foo |
The reason why static linking works fine with the -Wl,-wrap=malloc hook, is because of how static linking works:
- In static linking, the object code (or binary code) for the functions used from the static library is embedded directly into the final executable at link-time.
- So, when you use the
-Wl,-wrap=malloclinker option, it can intercept and replace all calls tomallocin both themainprogram and any static libraries, as they are all being linked together into a single executable at the same time. - Essentially, the linker sees the entire code (from the main program and the static library) as one unit and can replace all calls to
mallocwith calls to__wrap_malloc.
3.5.3.2 Dynamic Linking library(Not Working)
And here are how to build the program.
1 | gcc -o foo.o -c foo.cpp -O3 -Wall -fPIC |
And it prints:
1 | hello, this is foo |
Here’s a step-by-step breakdown:
- When you compile
foo.cppintofoo.o, there’s a call tomallocin the machine code, but it’s not yet resolved to an actual memory address. It’s just a placeholder that says “I want to callmalloc”. - When you link
foo.ointolibfoo.so, the call tomallocinsidefoois linked. It’s resolved to themallocfunction provided by the C library. - Later, when you link
main.cppinto an executable, you’re using the-Wl,-wrap=mallocoption, but that only affects calls tomallocthat are being linked at that time. The call tomallocinsidefoowas already linked in step 2, so it’s unaffected.
3.6 Reference
4 Name mangling
Name mangling, also known as name decoration or name encoding, is a technique used by compilers to encode the names of functions, variables, and other symbols in a program in a way that includes additional information about their types, namespaces, and sometimes other attributes. Name mangling is primarily used in languages like C++ to support features such as function overloading, function templates, and namespaces.
Here are some key points about name mangling:
- Function Overloading: In C++, you can define multiple functions with the same name but different parameter lists. Name mangling ensures that these functions have distinct mangled names so the compiler can differentiate between them during the linking process.
- Template Specialization: In C++, templates allow you to write generic code that works with different types. Name mangling encodes the template arguments and specializations so that the compiler can generate the correct code for each specialization.
- Namespace Resolution: When you use namespaces to organize your code, name mangling includes the namespace information in the mangled name to avoid naming conflicts.
- Type Information: Name mangling can encode information about the types of function parameters and return values, which can be used for type checking and to resolve overloaded function calls.
- Demangling: While the mangled names generated by the compiler are not meant to be human-readable, tools and libraries exist to “demangle” these names, converting them back into their original, human-readable form for debugging and error messages.
- Compiler-Specific: The specific rules for name mangling are compiler-dependent. Different C++ compilers, such as GCC, Clang, and MSVC, may use different name mangling schemes. These schemes are not standardized by the C++ language standard.
4.1 Encoding Elements
Name mangling (also known as name decoration) is a compiler-specific technique to encode C++ symbols into unique names. The exact format and rules for name mangling are dependent on the compiler and its version. Therefore, there isn’t a single standard for it. However, many C++ compilers follow (at least loosely) the Itanium C++ ABI for mangling names, especially on Unix-like systems.
Below are some common elements of name mangling based on the Itanium C++ ABI:
- Function Names:
_Z: Prefix for encoded names.N: Begins a nested name.E: Ends a nested name.
- Namespace and Class Names:
- Length of the name followed by the actual name. E.g.,
5OuterforOuter.
- Length of the name followed by the actual name. E.g.,
- Types:
i: intl: longs: shortd: doublef: floatc: charb: boolv: voidP: Pointer to a type (e.g.,Piis pointer to int)R: ReferenceO: rvalue referenceC1,C2: ConstructorD1,D2: Destructor
- Template Classes:
I: Marks the beginning of template arguments.E: Marks the end of template arguments.
- Const/Volatile qualifiers:
K: constV: volatiler: restrict (from C99)
- Function Arguments:
- Encoded in order, using their type encodings.
- Arrays:
- The size followed by the type, e.g.,
A10_iforint[10].
- The size followed by the type, e.g.,
- Modifiers:
U: Vendor-specific type qualifier.
- Special Names:
_vt: Virtual table_qt: Virtual table for a qualified name
- Operators:
- Most operators get their own special mangled name, e.g.,
_plforoperator+.
- Most operators get their own special mangled name, e.g.,
- CV Qualifiers:
K:constV:volatile
- Calling Convention:
- While the Itanium ABI doesn’t specify mangling for calling conventions (because it’s designed for architectures with a single calling convention), some other mangling schemes might have special symbols for this.
- Other Features:
S: String literal- And various encodings for other built-in types, custom types, etc.
4.2 Example
1 | namespace Outer::Inner { |
1 | # gcc-12.3.0 |
5 Address Sanitizer
Address Sanitizer (ASan) has its origins in Google. The project was started as a way to improve the detection of memory-related bugs, which have historically been some of the most elusive and difficult-to-diagnose issues in software development.
Here’s a brief history of Address Sanitizer:
- Early 2010s Origin: Address Sanitizer was developed by Konstantin Serebryany, Dmitry Vyukov, and other contributors at Google. The initial focus was on detecting memory issues in C++ programs, but the tool’s capabilities expanded over time.
- Release and Integration with Major Compilers: After its development, Address Sanitizer was integrated into major compilers. Clang was one of the first compilers to support ASan, and later, it was incorporated into GCC (GNU Compiler Collection). The ease of use—simply adding a compiler flag—made it very attractive for developers to adopt.
- Chromium Adoption: One of the early and significant adoptions of ASan was in the Chromium project (the open-source foundation of the Chrome browser). Given the scale and complexity of this project, and the potential security implications of memory bugs in a web browser, ASan proved to be an invaluable tool for ensuring the robustness and safety of the code.
- Expanding Beyond Address Sanitizer: The success of ASan led to the development of other “sanitizers” such as Thread Sanitizer (TSan) for detecting data races, Memory Sanitizer (MSan) for uninitialized memory reads, and Undefined Behavior Sanitizer (UBSan) for undefined behavior checks.
- Integration in Development Ecosystems: As ASan’s popularity grew, it found its way into various development ecosystems. Debugging tools, continuous integration systems, and even some integrated development environments (IDEs) began offering first-class support for ASan and related tools.
- Widening Support: Beyond just C++ and C, ASan also found applicability in other languages and platforms where the underlying memory model had similarities, further broadening its reach and impact.
It is a tool that can help developers find memory-related issues in their programs, such as:
- Use-after-free: Detects when a program uses memory after it has been freed.
- Heap buffer overflow: Detects when a program writes past the end of an allocated object on the heap.
- Stack buffer overflow: Detects when a program writes past the end of an allocated object on the stack.
- Global buffer overflow: Similar to the above but for global variables.
- Memory leaks: Identifies instances where memory is allocated but not freed, resulting in memory being lost until the program ends.
- Use-after-scope: Detects the usage of local variables outside of their scope.
- Initialization errors: Finds reads from uninitialized memory locations.
Address Sanitizer achieves this by instrumenting the binary code. When compiling code with Address Sanitizer enabled, the compiler (e.g., Clang or GCC) will insert additional checks around memory operations. Additionally, Address Sanitizer uses a shadow memory mechanism to keep track of the status (e.g., allocated, deallocated) of each byte in the application’s memory.
Because of this instrumentation, programs compiled with Address Sanitizer tend to run slower and use more memory than their non-instrumented counterparts. However, the benefits in terms of finding and fixing memory-related bugs can be substantial.
To use Address Sanitizer, developers typically pass the -fsanitize=address flag (and sometimes additional flags) when compiling and linking their code.
Remember, Address Sanitizer is not a substitute for other types of testing or for manual code review. However, when combined with other testing methodologies, it can be a powerful tool in a developer’s arsenal for ensuring software reliability and security.
5.1 How it works
Here’s an in-depth breakdown of how it works:
- Compile-time Instrumentation:
- When a program is compiled with ASan enabled (e.g., using the -fsanitize=address flag), the compiler inserts extra instructions around memory operations. These instructions help in checking for memory-related issues.
- This instrumentation helps the runtime component of ASan understand memory accesses and allocations/deallocations.
- Shadow Memory:
- ASan uses a concept called “shadow memory” to keep track of each byte of the application’s memory.
- For every 8 bytes of application memory, there’s a corresponding byte in the shadow memory. This shadow byte holds metadata about the status of those 8 bytes (whether they are allocated, deallocated, part of a redzone, etc.).
- Using shadow memory, ASan can quickly check the status of a memory location whenever the program accesses it. For example, if a program accesses memory that corresponds to a shadow byte indicating it’s deallocated, ASan can immediately flag a use-after-free error.
- Redzones:
- ASan places “redzones” (extra bytes) around allocated memory. These redzones are used to detect out-of-bounds accesses.
- If the program accesses memory inside a redzone, it indicates a buffer overflow or underflow.
- **Allocation and Deallocation:
- ASan replaces the standard memory allocation and deallocation functions (like malloc and free in C).
- When memory is allocated, ASan also sets up the corresponding shadow memory and redzones. When memory is deallocated, it is poisoned (marked in a way that any access will be flagged by ASan), helping detect use-after-free bugs.
- Memory Leak Detection:
- ASan can also track allocations that were never deallocated. At the end of the program’s execution, it can report these as memory leaks.
- Reporting:
- When ASan detects an error, it immediately halts the program and provides a detailed report. This report typically includes the type of error (e.g., buffer overflow), the memory address where the error occurred, and a stack trace, helping developers pinpoint and understand the cause.
- Performance Impact:
- ASan’s checks and shadow memory mechanism introduce overhead. Programs compiled with ASan typically run slower (often around 2x) and consume more memory than their non-instrumented counterparts.
- It’s important to understand that while ASan can detect a variety of memory errors, it’s not foolproof. For example, it might not detect all memory leaks, especially if they involve complex data structures. However, its ability to catch many common and critical memory errors makes it a valuable tool for developers.
When you compile your program with Address Sanitizer (ASan) enabled, the standard memory allocation and deallocation functions like malloc, free, new, and delete get intercepted or “wrapped” by ASan. This means that when your program calls malloc, it’s actually calling ASan’s version of malloc.
This interception is crucial for how ASan functions. Here’s why:
- Setting up Redzones: When memory is allocated, ASan’s version of
malloc(ornewfor C++) can add “redzones” around the allocated memory. These redzones help in detecting out-of-bounds accesses. - Shadow Memory Management: ASan maintains a shadow memory that maps to your program’s memory to track the state of each byte (e.g., allocated, deallocated). When memory is allocated or deallocated, ASan’s version of the memory functions update the shadow memory accordingly.
- Poisoning Memory: When memory is deallocated using ASan’s
freeordelete, the memory isn’t immediately returned to the system. Instead, it is “poisoned”. This means that any subsequent access to this memory will raise an error, helping in detecting use-after-free bugs. - Memory Leak Detection: By intercepting these calls, ASan can also maintain a list of all current allocations. When the program exits, it checks this list to report any memory that hasn’t been deallocated, indicating a memory leak.
Here’s an example to illustrate the mechanism:
1 |
|
1 | # dynamic link |
1 | # static link |
5.2 memory leak
1 | cat > test_memory_leak.cpp << 'EOF' |
5.3 stack buffer underflow
1 | cat > test_stack_buffer_underflow.cpp << 'EOF' |
5.4 How to config in Cmake
1 | option(ENABLE_ASAN "Enable AddressSanitizer" ON) |
5.5 Common ASAN_OPTIONS
| Option Name (Common) | Default | Description |
|---|---|---|
| detect_stack_use_after_return | 0 | Detect stack-use-after-return bugs (enable with 1). |
| detect_leaks | 1 | Enable LeakSanitizer (LSan) leak detection. |
| detect_odr_violation | 0 | Detect One Definition Rule violations. |
| detect_stack_use_after_scope | 0 | Detect stack-use-after-scope bugs. |
| detect_invalid_pointer_pairs | 1 | Detect invalid pointer pairs in heap. |
| abort_on_error | 0 | Abort on first error instead of continuing to report. |
| exitcode | 1 | Exit code returned when errors are detected. |
| fast_unwind_on_malloc | 0 | Use fast unwinding on malloc/free to speed up. |
| malloc_context_size | 30 | Number of stack frames captured on malloc/free. |
| symbolize | 1 | Enable symbolization of stack traces. |
| strip_path_prefix | (empty) | Strip prefix from file paths in reports. |
| log_path | (empty) | Path to output error reports. |
| suppressions | (empty) | Path to suppression file to ignore errors or leaks. |
| verbosity | 0 | Increase verbosity level (0=quiet, higher is more verbose). |
| allocator_may_return_null | 0 | Allocator returns null on OOM instead of aborting if set to 1. |
| disable_core | 0 | Disable core dumps when ASan errors occur. |
| handle_segv | 1 | Install SEGV handler to generate reports on segfaults. |
| detect_invalid_access_pairs | 1 | Detect invalid access pairs in heap. |
| handle_sigbus | 1 | Enable handling SIGBUS signals. |
| use_unaligned | 0 | Allow unaligned memory accesses. |
| max_malloc_fill_size | 0 | Maximum size of allocated memory to fill with junk pattern. |
| malloc_fill_byte | 0xAB | Byte used to fill newly allocated memory. |
| free_fill_byte | 0xCD | Byte used to fill freed memory. |
| detect_container_overflow | 0 | Detect overflow in container data structures (experimental). |
| quarantine_size_mb | 256 | Size of quarantine area (MB) for freed memory before reuse. |
| Option Name (Leak) | Default | Description |
| :– | :– | :– |
| detect_leaks | 1 | Enable leak detection. |
| max_leaks | 100 | Maximum number of leaks reported. |
| max_leaked_bytes | 100MB | Maximum number of bytes leaked before stopping leak reports. |
| leak_check_at_exit | 1 | Perform leak check at program exit. |
| leak_suppressions | (empty) | Path to a suppression file for leak sanitizer. |
| use_stacks | 1 | Capture stack traces for leaked objects. |
| Option Name (Other) | Default | Description |
| :– | :– | :– |
| report_globals | 1 | Report leaks of global/static variables. |
| detect_stack_hifreq | 0 | Detect high-frequency stack allocation bugs. |
| detect_tls_access | 0 | Detect invalid Thread Local Storage access. |
| disable_coredump | 0 | Disable generating coredump files. |
| malloc_deallocation_mismatch | 1 | Detect mismatched malloc/free or new/delete usage. |
5.6 Reference
- c++ Asan(address-sanitize)的配置和使用
- HOWTO: Use Address Sanitizer
- google/sanitizers
- 深入浅出 Sanitizer Interceptor 机制
6 Coroutines
6.1 Stackfull Coroutines
6.1.1 Manually Implement Context Switch
jump_fcontext and make_fcontext is copy from context.h and context.cpp
1 |
|
1 | create ctx1 |
6.1.2 Using Boost Context
1 |
|
1 | gcc -o main main.cpp -lstdc++ -std=gnu++17 -lboost_context |
7 GNU
7.1 Build & Install
You can download any version from gcc-ftp, I choose gcc-14.1.0
For China, refer to GCC mirror sites for suitable mirrors
1 | # Downloads |
Post Settings: (Use sudo ldconfig -p | grep stdc++ to check the default path of libstdc++.so.6)
-
Centos
1
2
3
4
5
6
7
8
9
10# Remove Original Gcc
sudo yum remove -y gcc gcc-c++
# Create soft link
sudo rm -f /usr/bin/gcc /usr/bin/g++ /usr/bin/cc /usr/bin/c++ /lib64/libstdc++.so.6
sudo ln -s /usr/local/bin/gcc /usr/bin/gcc
sudo ln -s /usr/local/bin/g++ /usr/bin/g++
sudo ln -s /usr/bin/gcc /usr/bin/cc
sudo ln -s /usr/bin/g++ /usr/bin/c++
sudo ln -s /usr/local/lib64/libstdc++.so.6.0.33 /lib64/libstdc++.so.6 -
Ubuntu
1
2
3
4
5
6
7
8
9
10# Remove Original Gcc
sudo apt remove -y gcc g++
# Create soft link
sudo rm -f /usr/bin/gcc /usr/bin/g++ /usr/bin/cc /usr/bin/c++ /usr/lib/x86_64-linux-gnu/libstdc++.so.6
sudo ln -s /usr/local/bin/gcc /usr/bin/gcc
sudo ln -s /usr/local/bin/g++ /usr/bin/g++
sudo ln -s /usr/bin/gcc /usr/bin/cc
sudo ln -s /usr/bin/g++ /usr/bin/c++
sudo ln -s /usr/local/lib64/libstdc++.so.6.0.33 /usr/lib/x86_64-linux-gnu/libstdc++.so.6
Issue:
error: 'fenv_t' has not been declared in '::': this error message occur when I’m build gcc-14 inside the docker container ofcentos:7.9.2009
7.2 GNU Binutils
The GNU Binutils are a collection of binary tools. The main ones are:
ld: the GNU linker.as: the GNU assembler.gold: a new, faster, ELF only linker.
But they also include:
addr2line: Converts addresses into filenames and line numbers.ar: A utility for creating, modifying and extracting from archives.c++filt: Filter to demangle encoded C++ symbols.dlltool: Creates files for building and using DLLs.elfedit: Allows alteration of ELF format files.gprof: Displays profiling information.gprofng: Collects and displays application performance data.nlmconv: Converts object code into an NLM.nm: Lists symbols from object files.objcopy: Copies and translates object files.objdump: Displays information from object files.ranlib: Generates an index to the contents of an archive.readelf: Displays information from any ELF format object file.size: Lists the section sizes of an object or archive file.strings: Lists printable strings from files.strip: Discards symbols.windmc: A Windows compatible message compiler.windres: A compiler for Windows resource files.
As well as some libraries:
libbfd: A library for manipulating binary files in a variety of different formats.libctf: A library for manipulating the CTF debug format.libopcodes: A library for assembling and disassembling a variety of different assembler languages.libsframe: A library for manipulating the SFRAME debug format.
Installation:
1 | wget https://ftp.gnu.org/gnu/binutils/binutils-2.39.tar.xz |
7.2.1 DWARF Error
1 | addr2line: Dwarf Error: found dwarf version '5', this reader only handles version 2, 3 and 4 information. |
- Try use different linker.
- Try use higher version of
binutils.
7.3 gcc
Common Parameter Descriptions:
- Compilation Information
-v: Outputs compilation details, including header file search paths, actual values of some environment variables, etc.-H: Outputs the header files used during compilation
- File Types
-E: Generate preprocessed file (.i)-S: Generate assembly file (.s)-fverbose-asm: Includes some annotation comments
-c: Generate object file (.o)- By default, generates an executable file
- Optimization Levels
-O0(default): No optimization-O/-O1: Tries to apply some optimizations to reduce code size and improve executable speed without affecting compilation speed-O2: This level sacrifices some compilation speed; besides all optimizations of-O1, it applies almost all supported optimizations for the target to improve runtime speed-O3: In addition to all-O2optimizations, generally uses many vectorization algorithms to increase code parallelism, utilizing modern CPU pipelines, caches, etc.
- The optimization options enabled at different levels can be referenced in the
man page
- Debugging
-gz[=type]: Compresses the debugging section ofDWARFformat files using the specified compression method-g: Generate debug information-ggdb: Generate debug information specific forgdb-gdwarf/-gdwarf-version: Generate debug info inDWARFformat; versions available are2/3/4/5, default is 4
-print-search-dirs: Print search paths-I <path>: Add header file search path- Multiple
-Iparameters can be used, e.g.-I path1 -I path2
- Multiple
-L <path>: Add library search path-l<lib_name>: Add library- Search for the specified static or dynamic library; if both exist, dynamic library is chosen by default
- For example,
-lstdc++,-lpthread
-std=<std_version>: Specify standard library type and version- For example,
-std=gnu++17
- For example,
-W<xxx>: Warning options-Wall: Enable most warning messages (some warnings cannot be enabled by this flag by default)-Wno<xxx>: Disable specific types of warnings-Werror: Treat all warnings as errors (will cause compilation to fail)-Werror=<xxx>: Treat a specific warning as an error (will cause compilation to fail)
-static: Use static linking for all libraries, includinglibcandlibc++-print-file-name=<library>: Print the full absolute name of the library file library that would be used when linkinggcc -print-file-name=libgcov.agcc -print-file-name=libdl.agcc -print-file-name=libstdc++.a
-D <macro_name>[=<macro_definition>]: Define macro- For example,
-D MY_DEMO_MACRO,-D MY_DEMO_MACRO=2,-D 'MY_DEMO_MACRO="hello"',-D 'ECHO(a)=(a)'
- For example,
-U <macro_name>: Undefine macro--coverage: a synonym for-fprofile-arcs -ftest-coverage(when compiling) and-lgcov(when linking)-fno-access-control: Disable access control, for example, allowing direct access to private fields and methods of a class from outside the class, generally used for unit testing- Vectorization Related Parameters
-fopt-info-vec/-fopt-info-vec-optimized: Output detailed information when loops are vectorized-fopt-info-vec-missed: Output detailed information when loops cannot be vectorized-fopt-info-vec-note: Output all detailed information about loop vectorization optimization-fopt-info-vec-all: Enable all parameters that output detailed vectorization information-fno-tree-vectorize: Disable vectorization- Generally, larger width vector registers require specifying these parameters:
-mmmx-msse,-msse2,-msse3,-mssse3,-msse4,-msse4a,-msse4.1,-msse4.2-mavx,-mavx2,-mavx512f,-mavx512pf,-mavx512er,-mavx512cd,-mavx512vl,-mavx512bw,-mavx512dq,-mavx512ifma,-mavx512vbmi- …
-fPIC: If the target machine supports it, generate position-independent code, suitable for dynamic linking and avoids any limitations on the size of the Global Offset Table-fomit-frame-pointer: When necessary, allow some functions to omit the frame pointer-fno-omit-frame-pointer: All functions must include a frame pointer
-faligned-new-fsized-deallocation: Enable thedeleteoperator that receives asizeparameter. C++ Sized Deallocation. Modern memory allocators, when allocating memory for objects, need to specify the size and for space efficiency do not store object size information around the object memory. Therefore, when freeing objects, the memory size occupied must be found, which is expensive because it is usually not in cache. The compiler allows providing aglobal delete operatorthat accepts asizeparameter and uses this version to destruct the object.-mcmodel=small/medium/large: is an option used in compilers like GCC (GNU Compiler Collection) to specify the memory model for code generation. This option is particularly relevant in systems with large address spaces, such as 64-bit architectures, where how the program accesses memory can significantly impact performance and compatibility.small- This is the default memory model.
- Assumes that all symbols are within 2GB of each other.
- Code and data are assumed to be close, which allows the compiler to use shorter and more efficient instructions for calls and references.
- Suitable for most applications where the total memory usage (including code, data, and stack) does not exceed 2GB.
medium- Used for applications larger than 2GB but less than a certain threshold (often around tens of GBs).
- Code is generated under the assumption that it will be within 2GB, but data may be farther away.
- This model uses absolute addresses for data and thus can handle larger data sizes, but still has limitations on the size of the code.
large- Designed for applications where both the code and data are larger than the limits of the medium model.
- Uses absolute addresses for both data and code, allowing for very large applications.
- However, this comes at the cost of efficiency, as the generated code is less optimized compared to the small and medium models.
7.3.1 How to link libc++ statically
Use g++:
1 | g++ -o main main.cpp -static-libstdc++ |
Use gcc:
1 | gcc main.cpp -o main -std=gnu++17 -Wl,-Bstatic -lstdc++ -Wl,-Bdynamic |
Use cmake:
1 | target_compile_options(<target> PRIVATE -static-libstdc++) |
7.3.2 Code Coverage
Here’s how it works: gcov determines which files to analyze for coverage information based on the profile data files (*.gcda and *.gcno) that are generated when you compile and run your program with the appropriate GCC flags (-fprofile-arcs and -ftest-coverage). Here’s a breakdown of how gcov knows which files to load:
- Compilation and Execution:
- When you compile your C/C++ program with GCC using
-fprofile-arcsand-ftest-coverage, it produces two types of files for each source file: *.gcno: These are generated during the compilation. They contain information about the source code’s structure (like basic blocks, branches, etc.).*.gcda: These are generated when the compiled program is run. They contain the actual coverage data, such as how many times each line of code was executed.
- When you compile your C/C++ program with GCC using
- Locating Files:
- When you invoke
gcov, it looks for.gcnoand.gcdafiles in the current directory by default. These files are named after the source files but with different extensions. - For example, if your source file is
example.c,gcovwill look forexample.gcnoandexample.gcdain the current directory.
- When you invoke
- Matching Source Files:
gcovuses the information in these files to match with the corresponding source file. It relies on the path and filename information stored in the.gcnoand.gcdafiles to find the correct source file.- If your source files are in a different directory, you may need to specify the path when running
gcov, or rungcovfrom the directory containing the.gcdaand.gcnofiles.
- Generating the Report:
- Once
gcovhas matched the.gcnoand.gcdafiles with their corresponding source files, it processes these files to generate a coverage report. This report shows how many times each line in the source file was executed.
- Once
- Manual Specification:
- You can also manually specify which source files to generate reports for by passing their names as arguments to
gcov.
- You can also manually specify which source files to generate reports for by passing their names as arguments to
Here’s an example of using gcc directly:
1 | cat > example.cpp << 'EOF' |
7.3.2.1 Disadvantages
-
.gcdaFiles are only written on graceful exit.- If the program crashes or is killed abruptly (e.g., kill -9), the
.gcdafiles might be missing or incomplete. - You can use
__gcov_flush()to manually flush coverage data at key points:1
2extern "C" void __gcov_flush(void);
__gcov_flush(); // Forces writing current coverage data to .gcda
- If the program crashes or is killed abruptly (e.g., kill -9), the
-
Each process/thread writing to the same
.gcdafile can lead to file corruption or data loss.- Use environment variables to separate outputs
1
2export GCOV_PREFIX=/tmp/coverage/$PID
export GCOV_PREFIX_STRIP=0
- Use environment variables to separate outputs
-
Don’t lose
.gcnofiles..gcnofiles are generated at compile time and contain structural info..gcdafiles are written at runtime with execution data.- If
.gcnois missing or mismatched with.gcda, gcov will fail.
-
Compiler optimizations may break coverage accuracy.
- Always compile with
-O0to avoid misleading coverage reports.
- Always compile with
-
Use higher-level tools (
gcovrorlcov) for reports. -
Clean old data before new runs.
- Leftover
.gcdafiles from previous runs can mess up your current coverage.
- Leftover
7.3.2.2 Difference between gcc compilation and CMake compilation
When you compile a source file using gcc with coverage flags:
1 | gcc -fprofile-arcs -ftest-coverage -O0 main.cpp -o main |
It produces:
- The
.gcnoand.gcdafiles are named simply after the basename of the source file (main). - There is no
.cppextension in the coverage data file names.
1 | main.gcno # at compile time |
When compiling the same file using CMake, it produces coverage files like:
- Note the difference: the filenames now include
.cppas part of the name, likemain.cpp.gcda. - This is conflict with the way gcov works.
1 | CMakeFiles/myapp.dir/src/main.cpp.gcno |
Cmake provides an option CMAKE_CXX_OUTPUT_EXTENSION_REPLACE that can eliminate this difference:
1 | set(CMAKE_CXX_OUTPUT_EXTENSION_REPLACE ON) |
Here’s an example of using cmake:
1 | mkdir -p code_coverage_demo |
7.3.2.3 Trigger flush manually
nm -g $(g++ -print-file-name=libgcov.a) cannot find symbol __gcov_flush, so use __gcov_dump instead.
1 | mkdir -p code_coverage_manual_flush_demo |
If you comment out setup_signal_handler, the file code_coverage_manual_flush_demo.cpp.gcda won’t include any code coverage information.
7.3.2.4 Use Customized Directory
1 | mkdir -p code_coverage_customized_directory_demo |
7.4 ld
种类
GNU ldGNU goldLLVM lld- mold
gcc如何指定linker
-B/usr/bin: For GNU ld, setup searching directory-fuse-ld=gold: For GNU gold-fuse-ld=lld: For LLVM lld-B/usr/local/bin/gcc-mold: For mold, setup searching directory
常用参数说明:
--verbose:打印链接时的详细信息,包括链接了哪些动态库-l <name>:增加库文件,查找lib<name>.a或者lib<name>.so,如果都存在,默认使用so版本-L <dir>:增加库文件搜索路径,其优先级会高于默认的搜索路径。允许指定多个,搜索顺序与其指定的顺序相同-rpath=<dir>:增加运行时库文件搜索路径(务必用绝路径,否则二进制一旦换目录就无法运行了)。-L参数只在编译、链接期间生效,运行时仍然会找不到动态库文件,需要通过该参数指定。因此,对于位于非默认搜索路径下的动态库文件,-L与-Wl,-rpath=这两个参数通常是一起使用的- What’s the difference between
-rpath-linkand-L? readelf -d <binary> | grep 'RPATH\|RUNPATH'
- What’s the difference between
-Bstatic:修改默认行为,强制使用静态链接库,只对该参数之后出现的库有效。如果找不到对应的静态库会报错(即便有动态库)-Bdynamic:修改默认行为,强制使用动态链接库,只对该参数之后出现的库有效。如果找不到对应的动态库会报错(即便有静态库)--wrap=<symbol>- 任何指向
<symbol>的未定义的符号都会被解析为__wrap_<symbol> - 任何指向
__real_<symbol>的未定义的符号都会被解析为<symbol> - 于是,我们就可以在
__wrap_<symbol>增加额外的逻辑,并最终调用__real_<symbol>来实现代理
1
2
3
4
5
6
7
8
9
10
11
12
13
14
15
16
17
18
19
20
21cat > proxy_malloc.c << 'EOF'
#include <stddef.h>
#include <stdio.h>
#include <stdlib.h>
void* __real_malloc(size_t c);
void* __wrap_malloc(size_t c) {
printf("malloc called with %zu\n", c);
return __real_malloc(c);
}
int main() {
int* num = (int*)malloc(sizeof(int));
return *num;
}
EOF
gcc -o proxy_malloc proxy_malloc.c -Wl,-wrap=malloc
./proxy_malloc- 任何指向
7.4.1 How to check default linker
1 | ls -l $(which ld) |
7.4.2 How to print dynamic lib path when linking program
1 | # default GNU ld |
7.4.3 How to determine which linker was used to link a binary file
1 | # method 1 |
7.5 lto-dump
7.6 ENV
Common:
CCCXXCFLAGSCXXFLAGSLDFLAGS:Specifies flags to pass to the linker (ld) when building programs
man gcc:
CPATH: Affects both C and C++ compilersC_INCLUDE_PATHCPLUS_INCLUDE_PATHOBJC_INCLUDE_PATHLIBRARY_PATH: Specifies the directories to search for library files at compile time
man ld:
LD_LIBRARY_PATH: Specifies the directories to search for shared libraries (dynamic libraries) at runtimeLD_RUN_PATH: Provides a way to ensure that your program can locate the shared libraries it depends on, regardless of the runtime environment (likeLD_LIBRARY_PATH), by embedding the necessary search paths directly into the executable
man ld.so
LD_LIBRARY_PATHLD_PRELOADLD_DEBUG/LD_DEBUG_OUTPUTLD_PROFILE/LD_PROFILE_OUTPUT
7.7 Reference
8 LLVM Tools
8.1 Build & Install
Doc:
- Getting Started with the LLVM System
- Getting Started: Building and Running Clang
- Extra Clang Tools
clang-tidyclang-include-fixerclang-renameclangdclang-doc
LLVM_ENABLE_PROJECTS vs. LLVM_ENABLE_RUNTIMES
LLVM_ENABLE_PROJECTS- Purpose: This option is used to specify which LLVM projects to build. These projects are typically related to the compiler infrastructure and tools.
- Examples of projects:
clang,lldb,lld, etc. - Usage: When you specify a project with
LLVM_ENABLE_PROJECTS, the build system includes it in the build process. - How can I know all the possible projects that supported by
LLVM_ENABLE_PROJECTS?cmake -B build -DCMAKE_BUILD_TYPE=Release -DLLVM_ENABLE_PROJECTS="invalid" llvm
LLVM_ENABLE_RUNTIMES- Purpose: This option is used to specify which LLVM runtimes to build. These runtimes are libraries and runtime components that are used by programs compiled with LLVM-based compilers.
- Examples of runtimes:
compiler-rt,libcxx,libcxxabi,libunwind, etc. - Usage: When you specify a runtime with
LLVM_ENABLE_RUNTIMES, the build system includes it in the build process, typically for building and installing the necessary runtime libraries.- If you specify item in
LLVM_ENABLE_RUNTIMES, then you don’t need to include it in theLLVM_ENABLE_PROJECTS, otherwise you may get an error.
- If you specify item in
- How can I know all the possible projects that supported by
LLVM_ENABLE_RUNTIMES?cmake -B build -DCMAKE_BUILD_TYPE=Release -DLLVM_ENABLE_PROJECTS="clang" -DLLVM_ENABLE_RUNTIMES="invalid" llvm
Build:
1 | LLVM_VERSION=16 |
Install specific target(Only for ninja):
1 | ninja -C build -t targets | grep -E '^install' |
8.1.1 Tips
- Build
release/11.xwith high version of gcc or clang, you may need to add additional-DCMAKE_CXX_STANDARD=17, otherwise, you may encounterno member named 'numeric_limits' in namespace 'std'
8.2 clang
Doc:
Options:
--gcc-install-dir=<value>: Use GCC installation in the specified directory, for standard library search path.--gcc-install-dir=/usr/local/lib/gcc/x86_64-pc-linux-gnu/14.1.0
-stdlib=<value>: C++ standard library to useclang -o main main.cpp -stdlib=libc++ -std=c++17 -lc++ -lc++abiclang -o main main.cpp -stdlib=libstdc++ -std=gnu++17 -lstdc++clang -o main main.cpp --gcc-install-dir=/usr/local/lib/gcc/x86_64-pc-linux-gnu/14.1.0 -stdlib=libstdc++ -std=gnu++17 -lstdc++
How to build with libc++:
1 | cmake -B build \ |
8.2.1 Code Coverage
Here’s an example of using clang directly:
1 | cat > main.cpp << 'EOF' |
Here’s an example of using cmake:
1 | mkdir -p code_coverage_demo |
8.2.1.1 Trigger flush manually
If a large-scale program using LLVM’s code coverage tools (like llvm-profraw via instrumentation with -fprofile-instr-generate) crashes or cannot shut down gracefully, the .profraw data may be incomplete or not written at all. This happens because profile data is typically written on normal process termination.
Solution: register a signal handler and invoke __llvm_profile_write_file manually.
1 | mkdir -p code_coverage_manual_flush_demo |
If you comment out setup_signal_handler, the size of coverage.profraw will be zero.
8.2.1.2 Merge Coverage
LLVM code coverage (using tools like llvm-cov and llvm-profdata) natively supports merging coverage data from multiple runs.
1 | mkdir -p code_merge_multi_coverage_demo |
8.2.1.3 Tips
- How to disable generating
.profrawfile:LLVM_PROFILE_FILE=/dev/null <binary> <args>
8.3 clang-format
如何使用:在用户目录或者项目根目录中创建.clang-format文件用于指定格式化的方式,下面给一个示例
- 优先使用项目根目录中的
.clang-format;如果不存在,则使用用户目录中的~/.clang-format
1 | --- |
注意:
- 即便
.clang-format相同,不同版本的clang-format格式化的结果也有差异
示例:
8.4 clangd
compile_commands.json vs. compile_flags.txt(JSON Compilation Database Format Specification)
- For complex projects, tools like
cmakecan generatecompile_commands.json:- First, it will look for
compile_commands.jsonin the current directory (or the directory specified by--compile-commands-dir). - If not found, it will recursively search in parent directories until it finds
compile_commands.jsonor reaches the root.
- First, it will look for
- For simple projects, you can directly configure
compile_flags.txt:- First, it will look for
compile_flags.txtin the current directory. - If not found, it will recursively search in parent directories until it finds
compile_flags.txtor reaches the root.
- First, it will look for
Options:
--query-driver=: Sets one or moreglobpatterns to search for header files in matching paths.- Example:
--query-driver=/usr/bin/**/clang-*,/path/to/repo/**/g++-*
- Example:
--compile-commands-dir=: Specifies the path to search forcompile_commands.json.- Example:
--compile-commands-dir=/home/test/code/duckdb/build
- Example:
8.4.1 .clangd Configuration
We can create a .clangd file in the root directory of the project to customize the configuration of clangd specific to the project.
Here is the DuckDB .clangd configuration file.
- Specifies the
compile_commands.jsonpath as:build/clangd(Can not find duckdb headers)
1 | CompileFlags: |
Other examples:
1 | CompileFlags: |
8.5 clang-tidy
clang-tidy is a clang-based C++ linter tool. Its purpose is to provide an extensible framework for diagnosing and fixing typical programming errors, like style violations, interface misuse, or bugs that can be deduced via static analysis. clang-tidy is modular and provides a convenient interface for writing new checks.
.clang-tidy Lookup mechanism:
- Clang-Tidy looks for a
.clang-tidyfile in the directory of the source file being analyzed. If it finds one, it uses the configuration specified in that file. - If no
.clang-tidyfile is found in the source file’s directory, Clang-Tidy will search parent directories for a.clang-tidyfile. This means you can place a.clang-tidyfile in the root of your project, and it will apply to all files within the project.
Example:
1 | Checks: > |
8.5.1 Warning Suppress Syntax
We can use NOLINT, NOLINTNEXTLINE, and NOLINTBEGIN ... NOLINTEND to suppress warnings if we don’t want to disable rules by default.
1 | class Foo { |
8.6 lld
8.7 lldb
9 Google Tools
9.1 bloaty
bloaty is a size profiler for binaries.
Install:
- For dependencies, it will use the existing ones on system, but they may be conflict with ABI versions. So we can comment out some of the
pkg_search_moduleorfind_packagecalls inCMakeLists.txtto force building dependencies itself.
Usage:
- Requirements:
<binary>is compiled with debug info. bloaty -d compileunits <binary>
10 Assorted
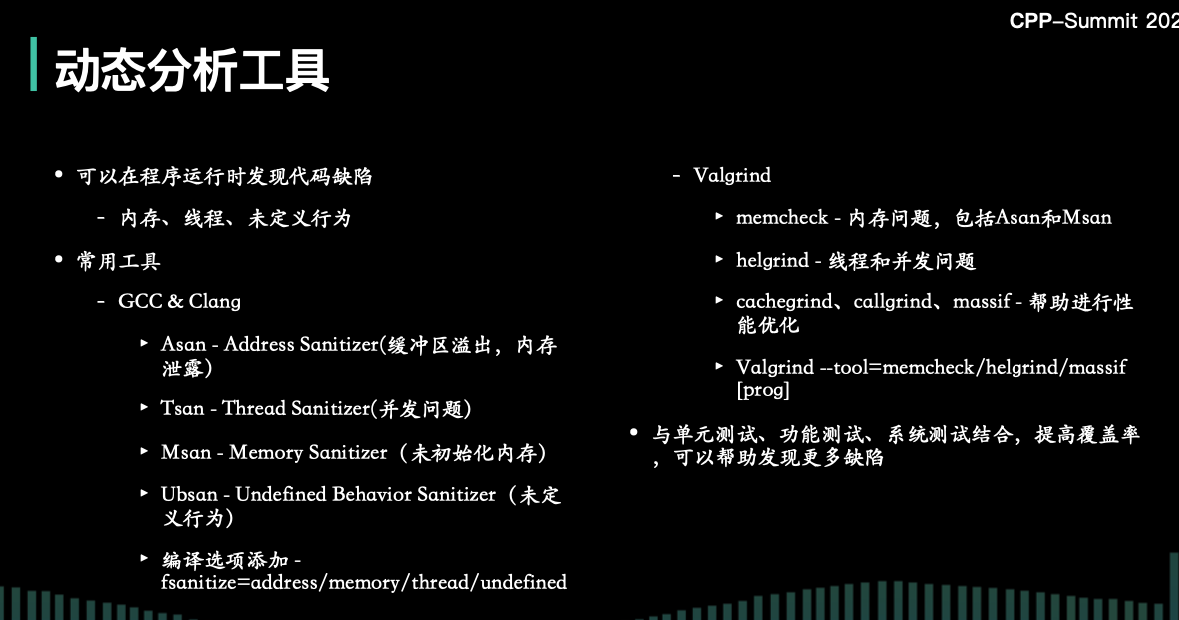
10.1 Dynamic Analysis
10.2 How to check the compile error message
Example:
1 | In file included from /starrocks/be/src/exprs/agg/approx_top_k.h:20: |
When interpreting compiler error messages, especially those involving template instantiation (which can be particularly verbose and intricate), there’s a general approach that you can take. Here’s how to approach such error messages:
- Start At The End:
- Often, the actual error (like a type mismatch, use of an undefined variable, etc.) is reported at the end of the message.
- In your provided message, the core error was at the end, stating the use of a deleted function.
- Work Your Way Up:
- Once you have the core error in mind, start moving upwards to see where in your code this problem originates. Often, the actual line of your code that triggers the error is one of the last things mentioned before the core error.
- In your case, the direct line of code causing the error was provided in
column_hash.h.
- Template Call Stack:
- Template errors tend to provide a “call stack” of sorts which traces the sequence of template instantiations that led to the error. This can be useful to understand the flow of logic and how you arrived at the error.
- In your message, this was the sequence starting from
phmap.h:1723:49and moving through various template functions/classes.
- Context:
- The initial part of the message usually provides the broader context: where the error started, what file it originated from, and so on.
- In your output, the initial message pointed to
column_hash.hbeing included fromapprox_top_k.h, providing a starting point for the cascade of template instantiation.
In Summary: While the bottom-up approach is useful for quickly identifying the core error and the immediate lines of code causing it, you sometimes need to go top-down to fully understand the context and sequence of events leading to the error. With experience, you’ll develop an intuition for quickly scanning and pinpointing the most relevant parts of such error messages.
10.3 How to check standard library search path when compiling
Add -v option.
10.4 ccache
CCache stores its compile cache in a directory specified by the CCACHE_DIR environment variable. By default, this directory is located at ~/.ccache in the user’s home directory. The cache directory contains various files and subdirectories that ccache uses to manage its cache of compiled objects.
How to work with cmake:
1 | export CMAKE_C_COMPILER_LAUNCHER=ccache |
Usage:
ccache -z: Zero statistics countersccache -s -v: show summary of configuration and statistics counters in human-readable format (use-v/--verboseonce or twice for more details).ccache --max-size=500G
10.5 Document
- cpp reference
- cppman
- 安装:
pip install cppman - 示例:
cppman vector::begin - 重建索引:
cppman -r
- 安装:
10.6 manpage
1 | sudo apt install -y gcc-doc |