阅读更多
1 Overview
Graduated and incubating projects
2 grafana
2.1 prometheus
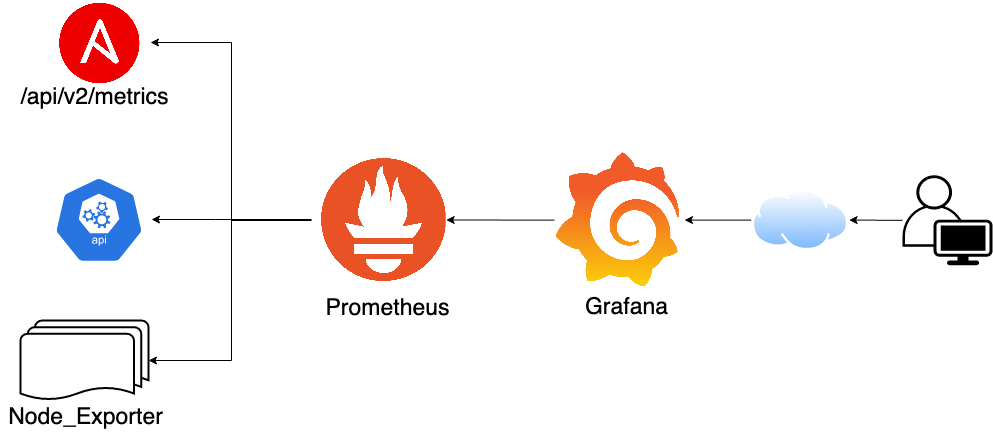
2.1.1 Step1: Install prometheus
Download package from here.
1 | # Default port is 9090 |
Tips:
up: Show all up machines.http://localhost:19090/metrics: List all metrics in text.
2.1.2 Step2: Install node-exporter
Download package from here.
1 | # Default port is 9100 |
Then add the following config to the scrape_configs part of prometheus.yml and restart prometheus.
1 | - job_name: 'node_exporter' |
2.1.3 Step3: Install grafana
Install grafa following the guide here.
The grafana will be started at the default port 3000.
Add datasource prometheus, and config the address.
Then search the grafana templates from here which you can import into your cluster directly.
2.1.4 Useful dashboard
1860: Node Exporter Full
2.2 参考
- Getting started with Prometheus Grafana and Node exporter - Part 1
- prometheus download
- https://www.cnblogs.com/dudu/p/12146344.html
- kubernetes1.18安装kube-prometheus
- grafana templates
- Prometheus核心组件