阅读更多
1 perf
perf命令具体用法参考Linux-Frequently-Used-Commands
1.1 event
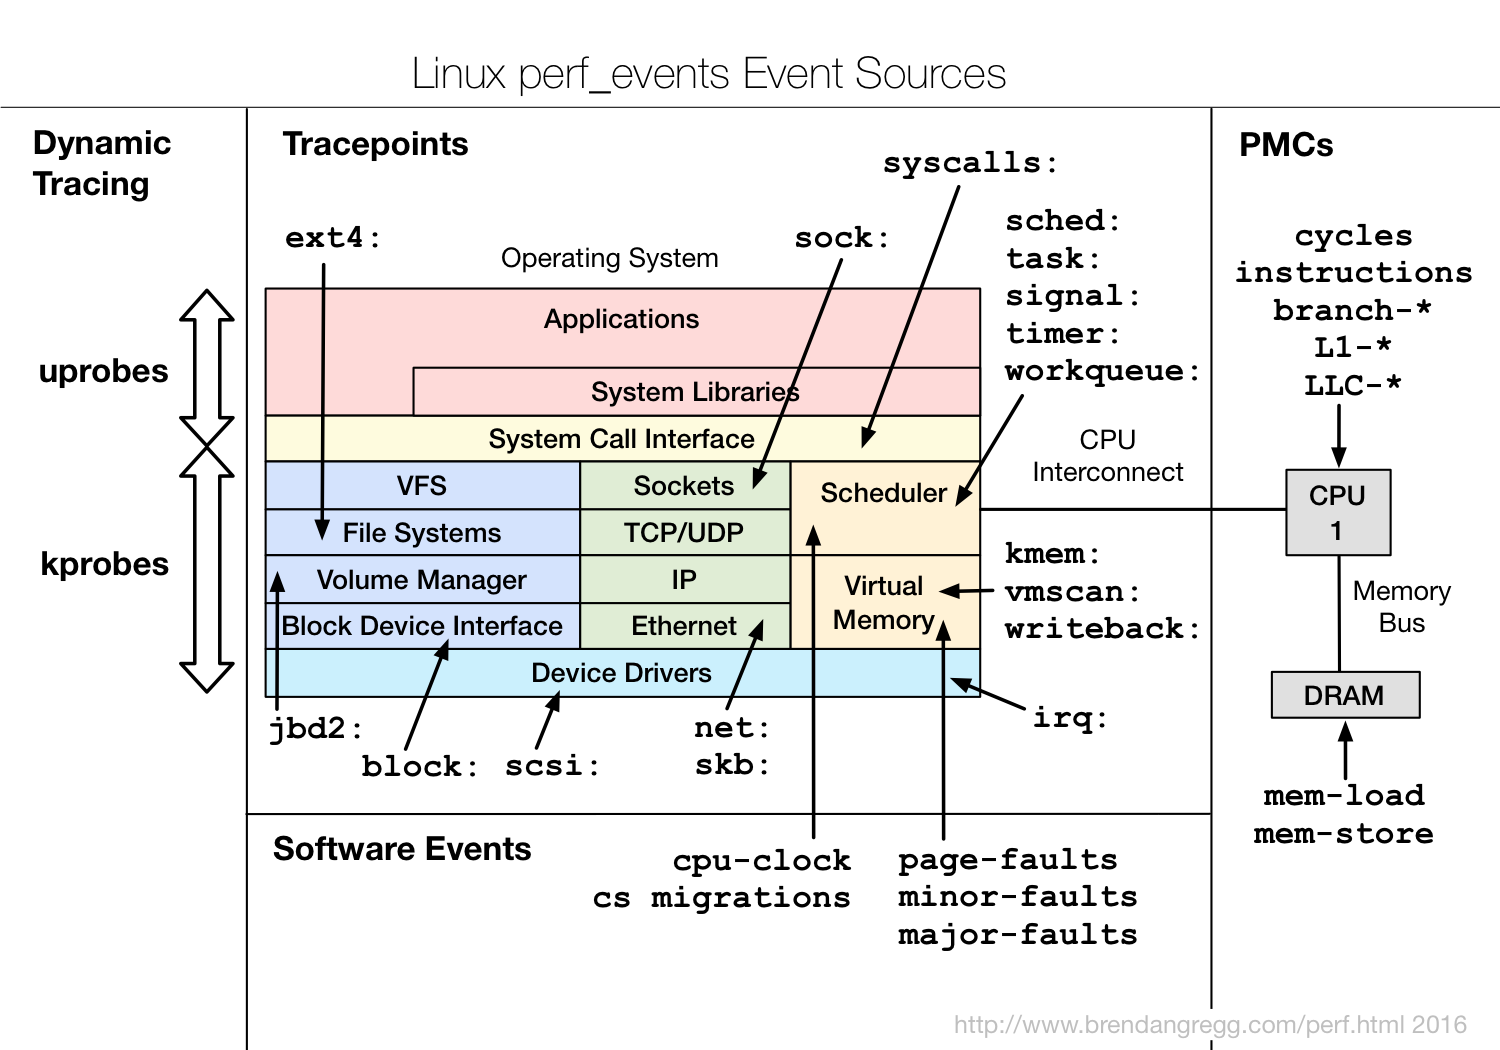
perf list可以查看当前环境支持的所有event。event可以分为Software event以及Tracepoint event两大类
Software event:需要采样的event。比如需要通过perf record -F 99指定采样频率Tracepoint event:不需要采样的event,有其固定的埋点,执行到了就会统计。Tracepoint event又可细分为许多类别
1.2 libperf
1.3 Reference
2 Flame Graph
2.1 CPU Flame Graph
相关git项目
1 | # 以 99Hz 的频率捕获指定进程的 cpu-clock 事件,捕获时长 60s,该命令会在当前目录生成 perf.data 文件 |
2.2 CPU Flame Graph for Java
相关git项目:
-
1
2
3
4
5
6
7
8
9
10
# Install
yum install -y centos-release-scl
yum install -y devtoolset-9
yum install -y cmake
scl enable devtoolset-9 bash
cd perf-map-agent && cmake . && make
# This is required by the runtime
yum install -y java-1.8.0-openjdk-devel
export JAVA_HOME=/usr/lib/jvm/java-1.8.0
Java进程相关配置:
-XX:+PreserveFramePointer
1 | # 以 99Hz 的频率捕获所有进程的 cpu-clock 事件,捕获时长 300s,该命令会在当前目录生成 perf.data 文件 |
2.3 Cache Miss Flame Graph
2.4 CPI Flame Graph
CPI Flame Graphs: Catching Your CPUs Napping
2.5 Summary
perf record默认采集的event是cpu-clock,因此这种方式做出来的就是CPU火焰图perf record配合-e参数,指定event类型,可以做出任意事件的火焰图
2.6 Reference
3 Off-CPU Analysis
分析工具:
>= Linux 4.8:eBPF, extended BPF- 要求
Linux版本至少是4.8 - 开销更小,因为它只捕获和转换独特的堆栈
- Linux eBPF Off-CPU Flame Graph
- 要求
< Linux 4.8:针对不同的blocking类型(I/O,scheduler,lock),需要使用不同的分析工具,例如SystemTap、perf event logging、BPF- 其他工具
time:一个非常简单的统计工具real:整体耗时user:用户态的CPU时间sys:内核态的CPU时间real - user - sys:off-CPU时间
brpc
其他参考:
3.1 Using perf
1 | # 启用调度的tracepoint,需要在root账号下执行,一般账号sudo可能执行不了 |
3.2 Using BPF
安装:
yum install bcc- 工具目录:
/usr/share/bcc/tools//usr/share/bcc/tools/offcputime
制作offcpu火焰图:
- 占比很小的堆栈会被忽略
1 | # 采样指定进程 30s |
看单个线程的offcpu堆栈:
- 会输出所有的堆栈,以及出现的时间(单位微秒),越后面的出现频率越高
1 | # 采样指定线程 30s |
4 VTune
安装Vtune-Profile:
- Offline Installer下载并安装,默认安装路径是
~/intel/oneapi/vtune - 二进制工具的目录:
${install_dir}/intel/oneapi/vtune/latest/bin64,记为vtune_bin_dirvtune-gui:可视化程序,需要X Window SystemMenuProject Navigator- 默认项目路径:
~/intel/vtune/projects,在其他机器采集到的数据,拷贝到这个目录下,即可打开 Open project貌似有问题
- 默认项目路径:
Config Analysis- 右下角
>_可获取与可视化配置等价的vtune采集命令
- 右下角
Compare resultsOpen Results- 貌似有问题
vtune:命令行工具,不需要X Window System${vtune_bin_dir}/vtune -collect hotspots --duration 30 --target-pid <pid>:会在当前目录下生成类似r000hs名称的目录,采集的数据会保存到该目录中${vtune_bin_dir}/vtune -collect hotspots --duration 30 --target-pid <pid> -r <target_dir>:采集的数据会保存到指定的目录中
vtune-self-checker.sh:环境自检
- 通常来说,使用
vtune-gui的机器,和目标机器(服务器一般不会装X Window System)不是同一台,有如下两种处理方式:- 在目标机器上,安装
Vtune-Profile(✅推荐) - 在目标机器上,安装
Vtune-Profile-Target(仅包含采集数据所需的软件包),但是会有坑(❌不推荐):- 自动安装:
Configure Analysis->Remote Linux(ssh)->Deploy - 手动安装:将
${install_dir}/intel/oneapi/vtune/latest/target/linux下的压缩包拷贝到目标机器上并解压
- 自动安装:
- 在目标机器上,安装
- 我的
MacOS系统版本是Monterey 12.0.1,这个版本无法远程Linux机器。如何解决?在目标Linux系统上安装X Window System、Vtune-Profile,通过vnc或者nx等远程桌面软件登录目标Linux机器,再通过vtune-gui打开Vtune-Profile,并分析本地的程序
大致流程:
- 假设有2台机器,
A和BA:需要X Window SystemB:无需X Window SystemA和B可以是同一台机器
- 分别在
A和B安装Vtune-Profile - 在
B机器上,使用vtune进行采样,假设生成的数据存放在r000hs目录中 - 将
B机器上的r000hs目录拷贝到A机器的~/intel/vtune/projects目录下 - 打开
A机器上的vtune-gui对项目r000hs进行分析
4.1 Reference
- Intel® VTune™ Profiler User Guide
- Intel® VTune™ Profiler User Guide - Run Command Line Analysis
- Intel® VTune™ Profiler User Guide - Window: Bottom-up
- Intel® VTune™ Profiler User Guide - Window: Caller/Callee
- Intel® VTune™ Profiler Performance Analysis Cookbook
- 《A Top-Down Method for Performance Analysis and Counters Architecture》阅读笔记
- Targets in Virtualized Environments
- Supported Architectures and Terminology
5 Chrome tracing view
https://github.com/StarRocks/starrocks/pull/7649
6 pcm
Processor Counter Monitor, pmc 包含如下工具:
pcm:最基础监控工具pcm-sensor-server:在本地提供一个Http服务,以JSON的格式返回metricspcm-memory:用于监控内存带宽pcm-latency:用于监控L1 cache miss以及DDR/PMM memory latencypcm-pcie:用于监控每个插槽的PCIe带宽pcm-iio:用于监控每个PCIe设备的PCIe带宽pcm-numa:用于监控本地以及远程的内存访问pcm-powerpcm-tsxpcm-core/pmu-querypcm-rawpcm-bw-histogram
7 sysbench
示例:
sysbench --test=memory --memory-block-size=1M --memory-total-size=10G --num-threads=1 runsysbench --test=cpu runsysbench --test=fileio --file-test-mode=seqwr runsysbench --test=threads runsysbench --test=mutex run
8 valgrind (by andy pavlo)
Tools:
memcheck: Detects memory-related errors.cachegrind: Cachegrind is a Valgrind tool used for profiling programs to analyze cache performance and identify bottlenecks in code. It simulates how your code uses the CPU’s cache hierarchy and memory, helping you optimize code by identifying areas with inefficient memory usage or poor cache locality.callgrind: Profiles function calls and CPU performance.helgrind: Detects data races and threading bugs.drd: Analyzes threading issues, similar to Helgrind.massif: Memory profiler focused on heap and stack usage.dhat: A tool for examining how programs use their heap allocations.lackey: An experimental tool that performs basic code instrumentation.
Example:
1 | cat > main.cpp << 'EOF' |
Reference:
- The Valgrind Quick Start Guide
- Callgrind: a call-graph generating cache and branch prediction profiler
- kcachegrind
- Tips for the Profiling/Optimization process
9 Best Practice
9.1 The primary metrics that performance analysis should prioritize
CyclesIPCInstructionsL1 MissLLC Miss, Last Level CacheBranch MissContention%usr、%sysbandwidth、packet rate、irq
9.2 What is the approach for performance bottleneck analysis?
CPU无法打满,可能原因包括:- 没有充分并行
- 存在串行点(
std::mutex) - 其他资源是否已经打满,导致CPU无法进一步提高,比如网卡、磁盘等
9.3 What is the approach for high system cpu analysis?
- Check system calls:
sudo perf stat -e "syscalls:sys_enter_*"