阅读更多
1 System Information
1.1 lsb_release
This command is used to view distribution information (lsb, Linux Standard Base). Other ways to check the distribution include:
uname -r: Kernel version number/etc/*-release, including:/etc/os-release/etc/centos-release/etc/debian_version
/proc/version
1.2 uname
Pattern:
uname [option]
Options:
-a, --all-s, --kernel-name-n, --nodename-r, --kernel-release-v, --kernel-version-m, --machine-p, --processor-i, --hardware-platform-o, --operating-system
Examples:
uname -auname -runame -s
1.3 dmidecode
Examples:
sudo dmidecode -s system-manufacturersudo dmidecode -s system-product-name
1.4 systemd-detect-virt
This command is used to determine whether the current machine is a physical machine or a virtual machine
Examples:
systemd-detect-virtnone: Physical machineqemu/kvm/...: Virtual machine
1.5 demsg
The kernel stores boot information in the ring buffer. If you don’t have time to view the information during boot, you can use dmesg to check it. Boot information is also saved in the /var/log directory, in a file named dmesg.
Examples:
dmesg -TLdmesg --level=warn,err
1.6 chsh
Pattern:
chsh [-ls]
Options:
-s: The name of the user’s new login shell.
Examples:
chsh -s /bin/zsh: Change login shell for current user.chsh -s /bin/zsh test: Change login shell for user test.
1.7 man
man 1: Standard Linux commandsman 2: System callsman 3: Library functionsman 4: Device descriptionsman 5: File formatsman 6: Games and entertainmentman 7: Miscellaneousman 8: System administration commandsman 9: Kernel routines
1.8 last
Examples:
last -x
1.9 who
This command is used to see who is currently logged into the system and what they are doing.
Examples:
whowho -u
1.10 w
This command is used to see who is currently logged into the system and what they are doing. It is slightly more powerful than who.
Examples:
w
1.11 which
Examples:
which -a ls
1.12 whereis
Examples:
whereis ls
1.13 file
The file command is used to determine the type of a file. It does this by examining the file’s content, rather than relying on its file extension. This command is useful for identifying various file types, such as text files, executable files, directories, etc.
Examples:
file ~/.bashrcfile $(which ls)
1.14 type
The type command is used to describe how its arguments would be interpreted if used as command names. It indicates if a command is built-in, an alias, a function, or an external executable. This command is helpful for understanding how a particular command is being resolved and executed by the shell.
Examples:
type ls
1.15 command
The command command is used to execute a command, ignoring shell functions and aliases. It ensures that the original external command is executed, which can be useful if a command name has been redefined as a function or an alias.
command -v lscommand -V ls- Difference between
lsandcomomand ls1
2
3alias ls='ls --color=auto -l'
ls # execute the alias
command ls # execute the original command
1.16 stat
The command stat is used to display file or file system status.
Examples:
stat <file>
1.17 useradd
Options:
-g: Specify the user group-G: Additional user groups-d: Specify the user home directory-m: Automatically create the user home directory-s: Specify the shell
Examples:
useradd test -g wheel -G wheel -m -s /bin/bashuseradd test -d /data/test -s /bin/bash
useradd steps when creating an account
- Create the required user group:
/etc/group - Synchronize
/etc/groupwith/etc/gshadow:grpconv - Set various properties for the new account:
/etc/passwd - Synchronize
/etc/passwdwith/etc/shadow:pwconv - Set the password for the account:
passwd <name> - Create the user’s home directory:
cp -a /etc/skel /home/<name> - Change the ownership of the user’s home directory:
chown -R <group> /home/<name>
1.17.1 Migrate User Directory
1 | # copy |
1.18 userdel
Options:
-r: Delete the user’s home directory
Examples:
userdel -r test
1.19 usermod
Options:
-d: Modify the user directory-s: Modify the shell
Examples:
usermod -s /bin/zsh admin: Modify the default shell of the specified accountusermod -d /opt/home/admin admin: Modify the user directory of the specified account- Note: Do not add a trailing
/to the new path. For example, do not write/opt/home/admin/, as this can causezshto fail to replace the user directory with the~symbol. This will make the command prompt display the absolute path instead of~.
- Note: Do not add a trailing
sudo usermod -aG docker username: Add the specified user to a user group; the user must log in again for the change to take effectgroups username: View the user groups
1.20 chown
Examples:
chown [-R] <user> <file/dir>chown [-R] <user>:<group> <file/dir>
1.21 passwd
Examples:
echo '123456' | passwd --stdin root
1.22 chpasswd
Examples:
echo 'username:password' | sudo chpasswd
1.23 id
This command is used to view user information, including uid, gid, and more.
Examples:
id: View information about the current userid <username>: View information about a specified userid -u: View the current user’s uidid -nu <uid>: View the username corresponding to the specified uid
1.24 getconf
This command is used to view system-related information.
Examples:
getconf -a | grep CACHE: View CPU cache-related configuration items
1.25 hostnamectl
Examples:
1 | hostnamectl set-hostname <name> |
1.26 date
Examples:
datedate "+%Y-%m-%d %H:%M:%S"date -s '2014-12-25 12:34:56': Change system time.
1.27 timedatectl
Examples:
timedatectl: Show time infotimedatectl set-timezone Asia/Shanghai: Change timezone
1.28 ntpdate
Examples:
ntpdate ntp.aliyun.comntpdate ntp.cloud.aliyuncs.com: On Alibaba Cloud ECS, time synchronization requires specifying the internal NTP service.
1.29 hexdump
Display file contents in hexadecimal, decimal, octal, or ascii
Examples:
hexdump -C <filename> | head -n 10
1.30 xxd
xxd is a command-line utility that creates a hex dump of a file or standard input. It can also do the reverse: convert a hex dump back into binary.
Examples:
xxd file.binxxd -r hex_dump.txt > recovered.bin
1.31 showkey
Examine the codes sent by the keyboard
Examples:
showkey -a
2 Common Processing Tools
2.1 ls
Options:
-a: do not ignore entries starting with..-l: use a long listing format.-t: sort by time, newest first; see--time.-S: sort by file size, largest first.-r: reverse order while sorting.-h: with-land-s, print sizes like1K234M2Getc.-I: do not list implied entries matching shell PATTERN.-1: list one file per line.
Examples:
ls -1ls -lht | head -n 5ls -lhtrls -lhSls *.txt: Find all files with the.txtextension, and note that you should not usels "*.txt".ls -I "*.txt" -I "*.cpp"ls -d */: List all subdirectories in the current directory.
2.2 echo
Pattern:
echo [-ne] [string/variable]- Variables inside
''are not interpreted, while variables inside""are interpreted
Options:
-n: Do not automatically add a newline at the end-e: Enable backslash escape sequences. If the string contains the following characters, they are specially handled rather than output as literal text:\a: Emit a warning sound\b: Delete the previous character\c: Do not add a newline at the end\f: Newline but cursor stays at the same position\n: Newline and move cursor to the beginning of the line\r: Move cursor to the beginning of the line without newline\t: Insert a tab\v: Same as\f\\: Insert a\character\nnn: Insert the ASCII character represented by the octal numbernnn
Examples:
echo ${a}echo -e "a\nb"echo -e "\u67e5\u8be2\u5f15\u64ce\u5f02\u5e38\uff0c\u8bf7\u7a0d\u540e\u91cd\u8bd5\u6216\u8054\u7cfb\u7ba1\u7406\u5458\u6392\u67e5\u3002": TransferUnicodetoUTF-8
Others:
-
Color control, explanation of control options:
1
2
3
4
5
6
7
8
9
10
11
12
13
14
15
16
17echo -e "\033[30m Black text \033[0m"
echo -e "\033[31m Red text \033[0m"
echo -e "\033[32m Green text \033[0m"
echo -e "\033[33m Yellow text \033[0m"
echo -e "\033[34m Blue text \033[0m"
echo -e "\033[35m Purple text \033[0m"
echo -e "\033[36m Cyan text \033[0m"
echo -e "\033[37m White text \033[0m"
echo -e "\033[40;37m Black background white text \033[0m"
echo -e "\033[41;37m Red background white text \033[0m"
echo -e "\033[42;37m Green background white text \033[0m"
echo -e "\033[43;37m Yellow background white text \033[0m"
echo -e "\033[44;37m Blue background white text \033[0m"
echo -e "\033[45;37m Purple background white text \033[0m"
echo -e "\033[46;37m Cyan background white text \033[0m"
echo -e "\033[47;30m White background black text \033[0m" -
How to output text containing
*- Printing asterisk (“*”) in bash shell
content="*"; echo ${content}:*will be expanded bysh/bash(not byzsh) to all files and directories in the current pathcontent="*"; echo "${content}": With quotes,*is output as the literal character
2.3 sed
Pattern:
sed [-nefr] [action] [file]STD IN | sed [-nefr] [action]
Options:
-n: Use silent mode. In standard sed, all data fromSTDINis usually displayed on the screen. With the-nparameter, only lines specially processed by sed will be displayed.-e: Edit sed actions directly on the command line.-f: Write sed actions in a file, and-f filenamecan execute the sed actions in the filename.-E/-r: Sed actions support extended regular expression syntax.- Without the
-rparameter, even()needs to be escaped, so it’s best to add the-rparameter. \0: Represents the entire matching string,\1represents group1, and so on.&: Represents the entire matching string.
- Without the
-i: Modify the file content directly instead of outputting it to the screen.
Action Format:
<action>: Applies to all lines.echo -e "a1\na2\nb1\nb2\n" | sed 's/[0-9]//g'
/<pattern>/<action>: Applies to lines matching<pattern>.echo -e "a1\na2\nb1\nb2\n" | sed '/a/s/[0-9]//g'
<n1>[,<n2>]<action>: Applies to lines from<n1>to<n2>(if<n2>is not provided, it applies only to<n1>).$represents the last line./<pattern1>/, /<pattern2>/: From the first line matching<pattern1>to the first line matching<pattern2>.- To use other symbols as separators, the first symbol needs to be escaped, e.g.,
\|<pattern1>|and\|<pattern1>|, \|<pattern2>|. echo -e "a1\na2\nb1\nb2\n" | sed '1s/[0-9]//g'echo -e "a1\na2\nb1\nb2\n" | sed '1,3s/[0-9]//g'echo -e "a1\na2\nb1\nb2\n" | sed '/a/,/b/s/[0-9]//g'
/<pattern>/{<n1>[,<n2>]<action>}: Applies to lines from<n1>to<n2>that match<pattern>(if<n2>is not provided, it applies only to<n1>).echo -e "a1\na2\nb1\nb2\n" | sed '/a/{1,3s/[0-9]//g}'
<n1>[,<n2>]{/<pattern>/<action>}: Applies to lines from<n1>to<n2>that match<pattern>(if<n2>is not provided, it applies only to<n1>).echo -e "a1\na2\nb1\nb2\n" | sed '1,3{/a/s/[0-9]//g}'
!: Negates the match.echo -e "a1\na2\nb1\nb2\n" | sed '/a/!s/[0-9]//g'echo -e "a1\na2\nb1\nb2\n" | sed '/a/!{1,3s/[0-9]//g}'echo -e "a1\na2\nb1\nb2\n" | sed '1,3{/a/!s/[0-9]//g}'
Action Explanation:
a: Append. Strings followingawill appear on a new line (the next line of the current line).c: Change. Strings followingccan replace the lines betweenn1andn2.d: Delete. Usually followed by no parameters.i: Insert. Strings followingiwill appear on a new line (the previous line of the current line).p: Print. Prints selected data, usually run with thesed -nparameter.s: Substitute. Performs substitution, usually with regular expressions, e.g.,1,20s/lod/new/g.- The separator can be
/or|. - If the separator is
/, ordinary|does not need to be escaped, but/does. - If the separator is
|, ordinary/does not need to be escaped, but|does. g: Replaces all occurrences in each line, otherwise only the first occurrence.I: Case-insensitive.
- The separator can be
r: Insert the contents of another text.
Examples:
a:
1 | echo -e "a\nb\nc" | sed '1,2anewLine' |
c:
1 | # /^a$/ matches the first line using a regular expression and requires the -r option |
d:
1 | # Delete from line 2 to the first line containing the character 'c' |
i:
1 | echo -e "a\nb\nc" | sed '1,2inewLine' |
p:
1 | # $ represents last line |
s:
1 | # Apply to all lines, for each line, replace the first 'a' with 'A' |
r:
1 | # Prepare file1 |
reverse match:
1 | echo -e "a\nb\nc\nd\ne" | sed '/a/!d' |
Note: On macOS, the -i option must be followed by an extension suffix to back up the original file. If the extension length is 0, no backup is made.
sed -i ".back" "s/a/b/g" example: Backup file will beexample.backsed -i "" "s/a/b/g" example: No backup is made
2.4 awk
Compared to sed (a pipeline command) which often acts on an entire line, awk (a pipeline command) tends to split a line into several “fields” for processing, making awk quite suitable for small-scale data processing.
Pattern:
awk [-F] '[/regex/] [condition] {action}' [filename]
Options:
-F: Specifies the delimiter. For example:-F ':',-F '[,.;]',-F '[][]'
Note that all subsequent actions in awk are enclosed in single quotes, and when printing with print, non-variable text, including formats (like tab \t, newline \n, etc.), must be defined in double quotes since single quotes are reserved for awk commands. For example, last -n 5 | awk '{print $1 "\t" $3}'.
awk Processing Flow:
- Reads the first line.
- If it contains a regular expression match (
[/regex/]), it skips the line if there is no match. If it matches (any substring), the first line’s data is assigned to variables like$0,$1, etc. - If there is no regex match, the first line’s data is assigned to
$0,$1, etc.
- If it contains a regular expression match (
- Based on the condition type, determines if subsequent actions need to be performed.
- Executes all actions and condition types.
- If there are more lines, repeats the steps above until all data is processed.
awk Built-in Variables:
ARGC: Number of command-line arguments.ARGV: Command-line argument array.ENVIRON: Access to system environment variables in a queue.FILENAME: Name of the fileawkis processing.FNR: Record number within the current file.FS: Input field separator, default is a space, equivalent to the command-line-Foption.NF: Total number of fields in each line ($0).NR: Line number currently being processed byawk.OFS: Output field separator.ORS: Output record separator.RS: Record separator.- These variables can be referenced within actions without
$, for example,last -n 5 | awk '{print $1 "\t lines: " NR "\t columns: " NF}'. - Additionally, the
$0variable refers to the entire record.$1represents the first field of the current line,$2the second field, and so on.
awk Built-in Functions
sub(r, s [, t]): Replaces the first occurrence of the regular expressionrin stringtwiths. By default,tis$0.gsub(r, s [, t]): Replaces all occurrences of the regular expressionrin stringtwiths. By default,tis$0.gensub(r, s, h [, t]): Replaces the regular expressionrin stringtwiths. By default,tis$0.h: If it starts withg/G, behaves likegsub.h: A number, replaces the specified occurrence.
tolower(s): Converts every character in stringsto lowercase.toupper(s): Converts every character in stringsto uppercase.length(s): Returns the length of the string.split(s, a [, r [, seps] ]): Split the string s into the array a and the separators array seps on the regular expression r, and return the number of fields. If r is omitted,FSis used instead.strtonum(s): Examine str, and return its numeric value. If str begins with a leading0xor0X, treat it as a hexadecimal number.echo 'FF' | awk '{ print strtonum("0x"$0) }'
printvs.printf:print expr-listprints with a newline character,printf fmt, expr-listdoes not print a newline character.cat /etc/passwd | awk '{FS=":"} $3<10 {print $1 "\t" $3}': Note that{FS=":"}acts as an action, so the delimiter changes to:from the second line onward; for the first line, the delimiter is still a space.cat /etc/passwd | awk 'BEGIN {FS=":"} $3<10 {print $1 "\t" $3}': Here,{FS=":"}is effective for the first line.echo -e "abcdefg\nhijklmn\nopqrst\nuvwxyz" | awk '/[au]/ {print $0}'.lvdisplay|awk '/LV Name/{n=$3} /Block device/{d=$3; sub(".*:","dm-",d); print d,n;}':- There are two actions, each with its own condition: one contains
LV Name, and the other containsBlock device. Each condition executes its corresponding action if met; if both are satisfied, both actions are executed (in this case, simultaneous satisfaction is impossible). - First, match the first condition;
nstores the volume group name, assumed to beswap. - Next, match the second condition;
dstores the disk name, assumed to be253:1. Using thesubfunction, replace253:withdm-, resulting indbeingdm-1. Printdandn. - Then, match the first condition;
nstores the volume group name, assumed to beroot. The content ofdis stilldm-1. - Finally, match the second condition;
dstores the disk name, assumed to be253:0. Using thesubfunction, replace253:withdm-, resulting indbeingdm-0. Printdandn.
- There are two actions, each with its own condition: one contains
Action Descriptions:
- In
awk, any action inside{}can be separated by a semicolon;if multiple commands are needed, or they can be separated by pressing theEnterkey.
BEGIN and END:
- In Unix
awk, two special expressions areBEGINandEND. These can be used in patterns (refer to theawksyntax mentioned earlier).BEGINandENDgive the program initial states and allow it to perform final tasks after scanning is complete. - Any operation listed after
BEGIN(inside{}) is executed beforeawkstarts scanning the input, and operations listed afterENDare executed after all input has been scanned. Therefore,BEGINis usually used to display and initialize variables, andENDis used to output the final result.
2.4.1 Using Shell Variables
Method 1:
- Surround the shell variable with
'"and"'(i.e., single quote + double quote + shell variable + double quote + single quote). - This method can only reference numerical variables.
1 | var=4 |
Method 2:
- Surround the shell variable with
"'and'"(i.e., double quote + single quote + shell variable + single quote + double quote). - This method can reference string variables, but the string cannot contain spaces.
1 | var=4 |
Method 3:
- Surround the shell variable with
"'"(i.e., double quote + single quote + double quote + shell variable + double quote + single quote + double quote). - This method allows referencing variables of any type.
1 | var=4 |
Method 4:
- Use the
-vparameter. This method is quite simple and clear when there are not many variables.
1 | var="this a test" |
2.4.2 Control Statements
All of the following examples are in BEGIN and are executed only once, without the need to specify a file or input stream.
if Statement:
1 | awk 'BEGIN{ |
while Statement:
1 | awk 'BEGIN{ |
for Statement:
1 | awk 'BEGIN{ |
do Statement:
1 | awk 'BEGIN{ |
2.4.3 Regular Expressions
1 | echo "123" | awk '{if($0 ~ /^[0-9]+$/) print $0;}' |
2.4.4 Best Practice
1 | echo "1 2 3 4 5 3 2 1" | tr ' ' '\n' | awk '{count[$1]++} END {for (num in count) print count[num], num}' | sort -k1,1nr -k2,2n |
2.5 cut
Pattern:
cut -b list [-n] [file ...]cut -c list [file ...]cut -f list [-s] [-d delim] [file ...]
Options:
list: RangeN: The Nth byte, character, or field counting from the firstN-: From the Nth to the end of the line, all characters, bytes, or fieldsN-M: From the Nth to the Mth (inclusive), all characters, bytes, or fields-M: From the first to the Mth (inclusive), all characters, bytes, or fields
-b: Split by bytes. These byte positions ignore multibyte character boundaries unless the-nflag is also specified-c: Split by characters-d: Custom delimiter, default is tab-f: Used with-d, specify which fields to display-n: Disable splitting multibyte characters. Only used with the-bflag. If the last byte of a character falls within the range specified by theListparameter of the-bflag, the character will be output; otherwise, it will be excluded
Examples:
echo "a:b:c:d:e" | cut -d ":" -f3: Outputscll | cut -c 1-10: Displays characters 1 to 10 of the query result
2.6 grep
grep searches for PATTERNS in each FILE
Pattern:
1 | grep [OPTION...] PATTERNS [FILE...] |
Options:
-c: Suppress normal output; instead print a count of matching lines for each input file.-i: Ignore case distinctions in patterns and input data, so that characters that differ only in case match each other.-o: Print only the matched (non-empty) parts of a matching line, with each such part on a separate output line.-e: UsePATTERNSas the patterns.-E: InterpretPATTERNSas extended regular expressions.-F: InterpretPATTERNSas fixed strings, not regular expressions.-P: InterpretPATTERNSas Perl-compatible regular expressions.-l: Suppress normal output; instead print the name of each input file from which output would normally have been printed. Scanning each input file stops upon first match.-n: Prefix each line of output with the 1-based line number within its input file.-v: Invert the sense of matching, to select non-matching lines.-r: Read all files under each directory, recursively, following symbolic links only if they are on the command line.--color=auto|never|always: Surround the matched (non-empty) strings, matching lines, context lines, file names, line numbers, byte offsets, and separators (for fields and groups of context lines) with escape sequences to display them in color on the terminal. The colors are defined by the environment variable GREP_COLORS. Can be never, always, or auto.-A <NUM>: PrintNUMlines of trailing context after matching lines.-B <NUM>: PrintNUMlines of leading context before matching lines.-C <NUM>: PrintNUMlines of output context--binary-files=<TYPE>: If a file’s data or metadata indicate that the file contains binary data, assume that the file is of typeTYPE.- If
TYPEiswithout-match, when grep discovers null input binary data it assumes that the rest of the file does not match; this is equivalent to the-Ioption. - If
TYPEistext, grep processes a binary file as if it were text; this is equivalent to the-aoption.
- If
Examples:
grep -rn '<content>' <dir>grep -P '\t'ls | grep -E "customer[_0-9]*\.dat"
2.7 ag
ack is an enhanced version of grep, and ag (The Silver Searcher) is an enhanced version of ack. ag uses extended regular expressions by default and recursively searches in the current directory.
Pattern:
ag [options] pattern [path ...]
Options:
-c: Count the number of times the ‘search string’ is found-i: Ignore case differences-l: Output matching filenames instead of matching content-n: Disable recursion-v: Invert match, i.e., output lines that do NOT contain the ‘search string’-r: Recursively search in the specified directory (default behavior)-A: Followed by a number, meaning “after” — output the matched line plus the following n lines-B: Followed by a number, meaning “before” — output the matched line plus the preceding n lines-C: Followed by a number — output the matched line plus n lines before and after
Examples:
ag printf
2.8 sort
Pattern:
sort [-fbMnrtuk] [file or stdin]
Options:
-f: Ignore case differences-b: Ignore leading spaces-M: Sort by month name, e.g., JAN, DEC-n: Sort numerically (default is lexicographical sort)-r: Reverse sort order-u: Likeuniq, output only one line for duplicate data-t: Field delimiter, default is Tab-k: Specify which field(s) to sort by
Examples:
cat /etc/passwd | sortcat /etc/passwd | sort -t ':' -k 3echo -e "a\nb\nb\na\nb\na\na\nc\na" | sort | uniq -c | sort -nrsort | uniq -c | sort -nr: Common way to count occurrences of identical patterns
echo "1 2 3 4 5 3 2 1" | tr ' ' '\n' | awk '{count[$1]++} END {for (num in count) print count[num], num}' | sort -k1,1nr -k2,2n: Sort by first column descending, then second column ascending
2.9 uniq
Pattern:
sort [options] [file or stdin]
Options:
-c: Count the number of occurrences-d: Only count duplicated entries-i: Ignore case differences-u: Only count entries that appear once
Examples:
echo -e 'a\na\nb' | uniq -cecho -e 'a\na\nb' | uniq -decho -e 'a\na\nb' | uniq -uecho -e "a\nb\nb\na\nb\na\na\nc\na" | sort | uniq -c | sort -nr
2.10 tr
tr is used for character processing, and its smallest processing unit is a character.
Pattern:
tr [-cdst] SET1 [SET2]
Options:
-c, --complement: Complement the specified characters. This means the part matchingSET1is not processed, while the remaining unmatched part is transformed.-d, --delete: Delete specified characters.-s, --squeeze-repeats: Squeeze repeated characters into a single specified character.-t, --truncate-set1: Truncate the range ofSET1to match the length ofSET2.
Character set ranges:
\NNN: Character with octal value NNN (1 to 3 octal digits).\\: Backslash.\a: Ctrl-G, bell character.\b: Ctrl-H, backspace.\f: Ctrl-L, form feed.\n: Ctrl-J, new line.\r: Ctrl-M, carriage return.\t: Ctrl-I, tab key.\v: Ctrl-X, vertical tab.CHAR1-CHAR2: A range of characters from CHAR1 to CHAR2, specified in ASCII order. The range must be from smaller to larger, not the other way around.[CHAR*]: This is specific to SET2, used to repeat the specified character until it matches the length of SET1.[CHAR*REPEAT]: Also specific to SET2, this repeats the specified character for the given REPEAT times (REPEAT is calculated in octal, starting from 0).[:alnum:]: All alphabetic characters and digits.[:alpha:]: All alphabetic characters.[:blank:]: All horizontal spaces.[:cntrl:]: All control characters.[:digit:]: All digits.[:graph:]: All printable characters (excluding space).[:lower:]: All lowercase letters.[:print:]: All printable characters (including space).[:punct:]: All punctuation characters.[:space:]: All horizontal and vertical space characters.[:upper:]: All uppercase letters.[:xdigit:]: All hexadecimal digits.[=CHAR=]: All characters equivalent to the specified character (theCHARinside the equals sign represents a custom-defined character).
Examples:
echo "abcdefg" | tr "[:lower:]" "[:upper:]": Converts lowercase letters to uppercase.echo -e "a\nb\nc" | tr "\n" " ": Replaces\nwith a space.echo "hello 123 world 456" | tr -d '0-9': Deletes digits from0-9.echo "'hello world'" | tr -d "'": Deletes single quotes.echo -e "aa.,a 1 b#$bb 2 c*/cc 3 \nddd 4" | tr -d -c '0-9 \n': Deletes everything except0-9, space, and newline characters.echo "thissss is a text linnnnnnne." | tr -s ' sn': Removes redundant spaces,s, andn.head /dev/urandom | tr -dc A-Za-z0-9 | head -c 20: Generates a random string.
2.11 jq
Options:
-c: Output in compact form (one line)
Examples:
-
Iterate over an array
1
2
3
4content='[{"item":"a"},{"item":"b"}]'
while IFS= read -r element; do
echo "Element: $element"
done < <(jq -c '.[]' <<< "$content") -
Extract elements
1
2
3
4content='{"person":{"name":"Alice","age":28,"address":{"street":"123 Main St","city":"Wonderland","country":"Fantasyland"},"contacts":[{"type":"email","value":"alice@example.com"},{"type":"phone","value":"555-1234"}]}}'
jq -c '.person | .address | .city' <<< ${content}
jq -c '.person.address.city' <<< ${content}
jq -c '.person.contacts[1].value' <<< ${content}
2.12 xargs
Options:
-r, --no-run-if-empty: Do not run the command if input is empty-I {}: Replace the placeholder{}in the following command with standard input-t: Print the commands to be executed
Examples:
docker ps -aq | xargs docker rm -fecho " a b c " | xargs: Implementingtrimls | xargs -I {} rm -f {}
2.13 tee
>, >>, etc. redirect the data stream to a file or device, so unless you read that file or device, you cannot further use the data stream. If you want to save part of the data stream during processing, you can use tee (essentially, tee duplicates stdout).
tee sends the data stream both to a file and to the screen (the output to the screen is stdout), allowing the next command to continue processing it (>, >> truncate stdout, thus cannot pass it as stdin to the next command).
Pattern:
tee [-a] file
Options:
-a: Append data to the file instead of overwriting
Examples:
command | tee <file> | command
2.14 cat
Pattern:
cat > [newfile] <<'END_MARKER'
Example: Note the difference between EOF and 'EOF'
- Search
Here Documentsinman bashto see the difference between these two
1 | name="test" |
Examples:
cat -v <file>: Show all invisible characters.cat -A <file>: equivalent to -vET.
2.15 tail
Examples:
tail -f xxx.txttail -n +2 xxx.txt: Output from the second line to the last line
2.16 find
Pattern:
find [file_path] [option] [action]
Options:
-name: Followed by a filename, supports wildcards. Note this matches relative paths-regex: Followed by a regular expression, Note this matches the full path-maxdepth: Followed by search depth-regextype: Type of regular expressionemacs: Default typeposix-awkposix-basicposix-egrepposix-extended
-type: Followed by typef: Regular file, default typed: Directory
Examples:
find . -name "*.c"find . -maxdepth 1 -name "*.c"find . -regex ".*/.*\.c"- Find files with suffixes
.cfgand.conffind ./ -name '*.cfg' -o -name '*.conf'find ./ -regex '.*\.cfg\|.*\.conf'find ./ -regextype posix-extended -regex '.*\.(cfg|conf)'
find . -type f -executable: Find executable binary files
2.17 locate
locate searches data inside an existing database /var/lib/mlocate, so it does not directly access the hard drive. Therefore, compared to find, it is faster.
Install:
1 | yum install -y mlocate |
Usage:
1 | # When using for the first time, update the database first |
2.18 cp
Examples:
cp -vrf /a /b: Recursively copy directory/ainto directory/b, including all files, directories, hidden files, and hidden directories inside/acp -vrf /a/* /b: Recursively copy all files and directories under/abut excluding hidden files and hidden directoriescp -vrf /a/. /b: Recursively copy all files, directories, hidden files, and hidden directories inside/ainto directory/b
2.19 rsync
rsync is used for file synchronization. It can synchronize files between a local computer and a remote computer, or between two local directories. It can also serve as a file copying tool, replacing the cp and mv commands.
The r in its name stands for remote, and rsync essentially means remote synchronization (remote sync). Unlike other file transfer tools (such as FTP or scp), the biggest feature of rsync is that it checks the existing files on both the sender and the receiver, transmitting only the parts that have changed (the default rule is changes in file size or modification time).
Pattern:
rsync [options] [src1] [src2] ... [dest]rsync [options] [user@host:src1] ... [dest]rsync [options] [src1] [src2] ... [user@host:dest]- About
/src- If
src1is a file, there is only one way to write it:src1. - If
src1is a directory, there are two ways to write it:src1: Copies the entire directory, includingsrc1itself.src1/: Copies the contents of the directory without includingsrc1itself.
- If
destdest: If copying a single file,destrepresents the target file. If not copying a single file,destrepresents a directory.dest/: Always represents a directory.- There is one exception: to represent the user directory on a remote machine, write it as
user@host:~/, otherwise~will be treated as a normal directory name.
Options:
-r: Recursive. This parameter is mandatory; otherwise, the command will fail.-a: Includes-rand also synchronizes metadata (e.g., modification time, permissions). By default,rsyncuses file size and modification time to determine if a file needs to be updated. With the-aparameter, differences in permissions will also trigger updates.-n: Simulate the command results.--delete: By default,rsyncensures that all contents of the source directory (excluding explicitly excluded files) are copied to the destination directory. It does not make the two directories identical and does not delete files. To make the destination directory a mirror copy of the source directory, use the--deleteparameter, which will remove files that exist only in the destination directory but not in the source directory.--exclude: Specifies exclude patterns. To exclude multiple files, this parameter can be repeated.--exclude='.*': Exclude hidden files.--exclude='dir1/': Exclude a specific directory.--exclude='dir1/*': Exclude all files in a specific directory but not the directory itself.
--include: Specifies file patterns that must be synchronized, often used together with--exclude.--compress, -z: Compress file data during the transfer.--progress, -P: Show progress.
Examples:
rsync -av /src/foo /dest: Copies the entire directory/src/foointo the directory/dest.rsync -av /src/foo/ /dest: Copies the contents of the directory/src/foointo the directory/dest.rsync -a --exclude=log/ dir1/ dir2: Copies the contents ofdir1into the directorydir2, excluding all subdirectories namedlog.rsync -a --exclude=log/ dir1 dir2: Copies the entiredir1directory into thedir2directory, excluding all subdirectories namedlog.rsync -a dir1 user1@192.168.0.1:~: Copies the entiredir1directory to a directory named~under the user directory ofuser1on the machine192.168.0.1, resulting in~/\~/dir1(a very tricky issue).rsync -a dir1 user1@192.168.0.1:~/: Copies the entiredir1directory to the user directory ofuser1on the machine192.168.0.1, resulting in~/dir1.
2.20 rm
Examples:
rm -rf /a/*: Recursively delete all files and directories under/a, but excluding hidden files and hidden directoriesrm -rf /path/{..?*,.[!.]*,*}: Recursively delete all files, directories, hidden files, and hidden directories under/pathrm -rf /path/!(a.txt|b.txt): Recursively delete all files and directories under/pathexcept fora.txtandb.txt, excluding hidden files and hidden directories- Requires enabling
extglobwith the commandshopt -s extglob - How to use
extglobinside/bin/bash -c:1
2
3
4
5
6
7
8
9
10
11
12mkdir -p rmtest
touch rmtest/keep
touch rmtest/text1
touch rmtest/text2
mkdir -p rmtest/sub
touch rmtest/sub/keep
touch rmtest/sub/text3
tree -N rmtest
/bin/bash -O extglob -c 'rm -rf rmtest/!(keep)'
# rmtest/sub/keep cannot be preserved
tree -N rmtest
- Requires enabling
2.21 tar
Pattern:
- Compression:
tar -jcv [-f ARCHIVE] [-C WORKING_DIR] [FILE...]tar -zcv [-f ARCHIVE] [-C WORKING_DIR] [FILE...]
- Query:
tar -jtv [-f ARCHIVE] [MEMBER...]tar -ztv [-f ARCHIVE] [MEMBER...]
- Decompression:
tar -jxv [-f ARCHIVE] [-C WORKING_DIR] [MEMBER...]tar -zxv [-f ARCHIVE] [-C WORKING_DIR] [MEMBER...]
Options:
-c: Create a new archive file, can be used with -v to view the filenames being archived during the process-t: View the contents of the archive file to see which filenames are included-x: Extract or decompress, can be used with -C to extract in a specific directory- Note, c t x are mutually exclusive
-j: Compress/decompress with bzip2 support, it’s best to use the filename extension *.tar.bz2-z: Compress/decompress with gzip support, it’s best to use the filename extension *.tar.gz-v: Display the filenames being processed during compression/decompression-ffilename: The filename to be processed follows -f, it’s recommended to write -f as a separate parameter-C: Change the working directory, subsequent filenames can use relative pathstar -czvf test.tar.gz /home/liuye/data/volumn1: After archiving, the file paths inside the compressed package are full paths, i.e.,/home/liuye/data/volumn1/xxxtar -czvf test.tar.gz data/volumn1: Executing this command, the file paths inside the compressed package are relative to the current directory, i.e.,data/volumn1/xxxtar -czvf test.tar.gz volumn1 -C /home/liuye/data: The file paths inside the compressed package are relative to/home/liuye/data, i.e.,volumn1/xxx
-p: Preserve the original permissions and attributes of the backup data, commonly used for backing up (-c) important configuration files-P: Preserve absolute paths, i.e., allow the backup data to include the root directory
Examples:
tar -czvf /test.tar.gz -C /home/liuye aaa bbb ccctar -zxvf /test.tar.gz -C /home/liuye: Extract to the/home/liuyedirectorytar -zxvf /test.tar.gz -C /home/liuye path/a.txt: Extract onlypath/a.txtto the/home/liuyedirectory`
tar cvf - /home/liuye | sha1sum:-indicates standard input/output, here it represents standard outputwget -qO- xxx.tar.gz | tar -xz -C /tmp/target
2.22 curl
Pattern:
curl [options] [URL...]
Options:
-s: Silent mode. Only displays content, generally used for executing scripts, for examplecurl -s '<url>' | bash -s-L: If the original link has a redirect, it will continue to access the new link-o: Specify the download filename-X: Specify theHttp Method, for examplePOST-H: AddHttp Header-d: Specify theHttp Body-u <username>:<password>: For services that require authentication, you need to specify the username or password.:<password>can be omitted and entered interactively
Examples:
curl -L -o <filename> '<url>'
2.23 wget
Pattern:
wget [options] [URL]...
Options:
-O: Followed by the name of the file to be downloaded-r: Recursive download (used for downloading folders)-nH: When downloading folders, do not create a host directory-np: Do not access the parent directory-P: Specify the download directory-R: Specify the exclusion list--proxy: Followed by the proxy address
Examples:
wget -O myfile 'https://www.baidu.com'wget -r -np -nH -P /root/test 'http://192.168.66.1/stuff': Recursive download.wget -r -np -nH -P /root/test -R "index.html*" 'http://192.168.66.1/stuff': Recursive download but excluding patternindex.html*.wget -r -np -nH -P /root/test 'ftp://192.168.66.1/stuff': Recursive download.wget --proxy=http://proxy.example.com:8080 http://example.com/file
2.24 tree
Pattern:
tree [option]
Options:
-N: Display non-ASCII characters, can show Chinese-L [num]: Control the display depth level
2.25 split
Examples:
split -b 2048M bigfile bigfile-slice-: Split the file by size, each split file is up to2048M, with the prefixbigfile-slice-split -l 10000 bigfile bigfile-slice-: Split the file by lines, each split file contains up to10000lines, with the prefixbigfile-slice-
2.26 base64
Used for base64 encoding and decoding of input
Examples:
echo "hello" | base64echo "hello" | base64 | base64 -d
2.27 md5sum
Calculate the MD5 checksum of input or file
Examples:
echo -n "hello" | md5sum
2.28 openssl
This command is used to encrypt or decrypt files using a specified algorithm
Examples:
openssl -h: View all supported encryption and decryption algorithmsopenssl aes-256-cbc -a -salt -in blob.txt -out cipheropenssl aes-256-cbc -a -d -in cipher -out blob-rebuild.txt
2.29 bc
bc can be used for base conversion
Examples:
echo "obase=8;255" | bc: Convert decimal to octalecho "obase=16;255" | bc: Convert decimal to hexadecimal((num=8#77)); echo ${num}: Convert octal to decimal((num=16#FF)); echo ${num}: Convert hexadecimal to decimal
2.30 dirname
dirname is used to return the directory part of a file path. This command does not check whether the directory or file corresponding to the path actually exists.
Examples:
dirname /var/log/messages: returns/var/logdirname dirname aaa/bbb/ccc: returnsaaa/bbbdirname .././../.././././a: returns.././../../././.
Usually used in scripts to get the directory where the script is located, example shown below:
1 | # Here $0 represents the script path (relative or absolute) |
2.31 addr2line
This command is used to view the correspondence between binary offsets and source code. If the binary and the machine that produced the core file are not the same, symbol table mismatches may occur, resulting in incorrect source code locations.
Examples:
addr2line 4005f5 -e test: View the source code corresponding to the instruction at position4005f5in the binarytest
2.32 ldd
This command is used to see which dynamic libraries an executable file is linked to
Examples:
ldd mainreadelf -a ./main | grep NEEDEDobjdump -x ./main | grep NEEDED
2.33 ldconfig
Generate dynamic library cache or read dynamic library information from cache
Examples:
ldconfig: Regenerate/etc/ld.so.cacheldconfig -v: Regenerate/etc/ld.so.cacheand output detailed informationldconfig -p: Read and display dynamic library information from/etc/ld.so.cache
2.34 objdump
This command is used for disassembly
Examples:
objdump -drwCS main.oobjdump -drwCS -M intel main.oobjdump -p main
2.35 objcopy & strip
This command is used to extract debug information from binaries. Example:
[Enhancement] strip debug symbol in release mode
1 | objcopy --only-keep-debug main main.debuginfo |
When you’re debugging the binary through gdb, it will automatically load the corresponding debug info file, and you can also manually load it using the symbol-file command, like (gdb) symbol-file /path/to/binary_file.debuginfo.
2.36 nm
This command is used to view the symbol table
Examples:
nm -C mainnm -D xxx.so
2.37 strings
This command is used to view all string information contained in a binary file
Examples:
strings main
2.38 iconf
Options:
-l: List all encodings-f: Source encoding-t: Target encoding-c: Ignore problematic encodings-s: Suppress warnings-o: Output file--verbose: Output file processing progress
Examples:
iconv -f gbk -t utf-8 s.txt > t.txt
2.39 expect
expect is an automation tool for interactive sessions. By writing custom configurations, it can automatically fill in data.
Examples:
1 | cat > /tmp/interact.cpp << 'EOF' |
2.40 parallel
The parallel command is a powerful utility in Unix-like operating systems designed for running multiple shell commands in parallel, rather than sequentially. This can significantly speed up the execution of tasks that can be performed concurrently, especially when processing large amounts of data or performing operations on multiple files or processes at the same time.
Pattern:
parallel command ::: argument1 argument2 argument3
Options:
-j N: Specifies the number of jobs to run in parallel. If not specified, parallel attempts to run as many jobs in parallel as there are CPU cores.-k: Keep sequence of output same as the order of input. Normally the output of a job will be printed as soon as the job completes.-n max-args: Use at most max-args arguments per command line.-n 0means read one argument, but insert 0 arguments on the command line.
:::: Used to specify arguments directly on the command line.
Examples:
parallel -j1 sleep {}\; echo {} ::: 2 1 4 3parallel -j4 sleep {}\; echo {} ::: 2 1 4 3parallel -j4 -k sleep {}\; echo {} ::: 2 1 4 3seq 10 | parallel -n0 echo "hello world": Run the same command 10 timesseq 2 | parallel -n0 cat test.sql '|' mysql -h 127.0.0.1 -P 3306 -u root -D testseq 2 | parallel -n0 mysql -h 127.0.0.1 -P 3306 -u root -D test -e \'source test.sql\'
3 Device Management
3.1 mount
This command is used to mount a file system
Pattern:
mount [-t vfstype] [-o options] device dir
Options:
-t: Followed by the file system type; if not specified, it will auto-detect-o: Followed by mount options
Examples:
mount -o loop /CentOS-7-x86_64-Minimal-1908.iso /mnt/iso
3.1.1 Propagation Level
When the kernel initially introduced mount namespace, the isolation between namespaces was weak. For example, if a mount or umount action was performed in one namespace, the event would propagate to other namespaces, which is unsuitable in certain scenarios.
Therefore, starting from version 2.6.15, the kernel allows marking a mount point as shared, private, slave, or unbindable to provide fine-grained isolation control:
shared: The default propagation level;mountandunmountevents propagate between different namespacesprivate: Prohibitsmountandunmountevents from propagating between different namespacesslave: Allows only one-way propagation, i.e., events generated by themasterpropagate to theslaveunbindable: Disallowsbindoperations; under this propagation level, new namespaces cannot be created
3.2 umount
This command is used to unmount a file system
Examples:
umount /home
3.3 findmnt
This command is used to view information about mount points
Options:
-o [option]: Specify the columns to display
Examples:
findmnt -o TARGET,PROPAGATION
3.4 free
Pattern:
free [-b|-k|-m|-g|-h] [-t]
Options:
-b: bytes-m: MB-k: KB-g: GB-h: Adaptive
Description of Display Parameters:
Mem: Physical memorySwap: Virtual memorytotal: Total memory size, this information can be obtained from/proc/meminfo(MemTotal,SwapTotal)user: Used memory size, calculated astotal - free - buffers - cachefree: Unused memory size, this information can be obtained from/proc/meminfo(MemFree,SwapFree)shared: Memory used bytmpfs, this information can be obtained from/proc/meminfo(Shmem)buffers: Memory used by kernel buffers, this information can be obtained from/proc/meminfo(Buffers)cached: Memory used byslabsandpage cache, this information can be obtained from/proc/meminfo(Cached)available: Memory still available for allocation to applications (excludingswapmemory), this information can be obtained from/proc/meminfo(MemAvailable)- Generally, the system will efficiently use all available memory to accelerate system access performance, which is different from Windows. Therefore, for Linux systems, the larger the memory, the better.
Examples:
free -m
3.5 swap
Make swap:
1 | dd if=/dev/zero of=/tmp/swap bs=1M count=128 |
3.6 df
Options:
-h: UseK,M,Gunits to improve readability of the information-i: Displayinodeinformation-T: Display the file system type explicitly
Examples:
df -hdf -ihdf -Th
3.7 du
Pattern:
du
Options:
-h: UseK,M,Gunits to improve readability-s: Show only the total-d <depth>: Specify the depth of files/folders to display
Examples:
du -sh: Total size of the current folderdu -h -d 1: List the sizes of all files/folders at depth 1du -h -d 1 | sort -hdu -h -d 1 | sort -hr
3.8 ncdu
ncdu (NCurses Disk Usage) is a curses-based version of the well-known du, and provides a fast way to see what directories are using your disk space.
Examples:
ncduncdu /
3.9 lsblk
This command is used to list information about all available block devices
Pattern:
lsblk [option]
Options:
-a, --all: Print all devices-b, --bytes: Print SIZE in bytes instead of a human-readable format-d, --nodeps: Do not print slave or holder devices-D, --discard: Print discard capabilities-e, --exclude <list>: Exclude devices by major device number (default: memory disks)-I, --include <list>: Only show devices with the specified major device numbers-f, --fs: Output file system information-h, --help: Show help information (this message)-i, --ascii: Use only ASCII characters-m, --perms: Output permission information-l, --list: Use list format output-n, --noheadings: Do not print headings-o, --output <list>: Specify output columns-p, --paths: Print full device paths-P, --pairs: Use key=“value” output format-r, --raw: Use raw output format-s, --inverse: Inverse dependencies-t, --topology: Output topology information-S, --scsi: Output information about SCSI devices
Examples:
lsblk -fplsblk -o name,mountpoint,label,size,uuid
3.10 lsusb
This command is used to list all devices on USB interfaces
3.11 lspci
This command is used to list all devices on PCI interfaces
3.12 lscpu
This command is used to list CPU devices
3.13 sync
This command is used to force data stored in the buffer to be written to the hard disk
3.14 numactl
This command is used to set and view NUMA information
Options:
--hardware: Display hardware information, including the number ofNUMA-Nodes, CPUs corresponding to eachNode, memory size, and a matrix representing the memory access cost betweennode[i][j]--show: Display the currentNUMAsettings--physcpubind=<cpus>: Bind execution to<cpus>.<cpus>refers to theprocessorfield in/proc/cpuinfo.<cpus>can be:all,0,5,10,2-8--cpunodebind=<nodes>: Bind execution to<nodes>.<nodes>can be:all,0,1,6,0-3Memory Policy--interleave=<nodes>: Allocate memory in a round-robin manner across<nodes>--preferred=<node>: Prefer allocating memory from<node>--membind=<nodes>: Allocate memory on<nodes>--localalloc: Allocate memory on the node where the CPU is located; requires CPU binding to optimize<nodes>can be:all,0,1,6,0-3
Examples:
numactl --hardwarenumactl --show: Display currentNUMAsettings
3.15 hdparm
hdparm is a command-line utility in Linux used primarily for querying and setting hard disk parameters. It’s a powerful tool that provides a variety of functions allowing users to manage the performance of their disk drives. The most common use of hdparm is to measure the reading speed of a disk drive, but its capabilities extend much further.
Examples:
hdparm -Tt /dev/sda
3.16 file
determine file type
Examples:
file xxx
3.17 realpath
print the resolved path
Examples:
realpath xxx
3.18 readelf
This command is used to read and analyze executable programs
Options:
-d: Output information related to dynamic linking (if any)-s: Output symbol information
Examples:
readelf -d libc.so.6readelf -s --wide xxx.so
3.19 readlink
print resolved symbolic links or canonical file names
Examples:
readlink -f $(which java)
4 Process Management
Background Process (&):
Appending & at the end of a command means executing the command in the background.
- At this point, bash will assign the command a job number, followed by the PID triggered by the command.
- It cannot be interrupted with
[Ctrl]+C. - For commands executed in the background, if there is stdout or stderr, their output still goes to the screen. As a result, the prompt may not be visible. After the command finishes, you must press
[Enter]to see the command prompt again. It also cannot be interrupted using[Ctrl]+C. The solution is to use stream redirection.
Examples:
tar -zpcv -f /tmp/etc.tar.gz /etc > /tmp/log.txt 2>&1 &Ctrl+C: Terminates the current processCtrl+Z: Pauses the current process$!: Stores the PID of the most recently started background process
4.1 jobs
Pattern:
jobs [option]
Options:
-l: In addition to listing the job number and command string, also displays the PID number-r: Lists only the jobs currently running in the background-s: Lists only the jobs currently stopped in the background- Meaning of the
+and-symbols in the output:+: The most recently placed job in the background, representing the default job to be brought to the foreground when just ‘fg’ is entered-: The second most recently placed job in the background- For jobs older than the last two, there will be no
+or-symbols
Examples:
jobs -lrjobs -ls
4.2 fg
Bring background jobs to the foreground for processing
Examples:
fg %jobnumber: Brings the job with the specifiedjobnumberto the foreground.jobnumberis the job number (a digit), and the%is optionalfg +: Brings the job marked with+to the foregroundfg -: Brings the job marked with-to the foreground
4.3 bg
Resume a job to running state in the background
Examples:
bg %jobnumber: Resumes the job with the specifiedjobnumber.jobnumberis the job number (a digit), and the%is optionalbg +: Resumes the job marked with+bg -: Resumes the job marked with-- Jobs like vim cannot be resumed to running state in the background—even if this command is used, such jobs will immediately return to a stopped state
4.4 kill
The command is used to terminate processes.
Pattern:
kill [-signal] PIDkill [-signal] %jobnumberkill -l
Options:
-l: Lists the signals currently available for use with thekillcommand-signal:-1: Reloads the configuration file, similar to a reload operation-2: Same as pressing [Ctrl]+C on the keyboard-6: Triggers a core dump-9: Immediately and forcibly terminates a job; commonly used for forcefully killing abnormal jobs-15: Terminates a job gracefully using the normal program procedure. Unlike-9,-15ends a job through the regular shutdown process and is the default signal
- Unlike
bgandfg, when managing jobs withkill, the%symbol cannot be omitted, becausekillinterprets the argument as a PID by default
4.5 pkill
Pattern:
pkill [-signal] PIDpkill [-signal] [-Ptu] [arg]
Options:
-f: Matches the fullcommand line; by default, only the first 15 characters are matched-signal: Same as inkill-P ppid,...: Matches the specifiedparent id-s sid,...: Matches the specifiedsession id-t term,...: Matches the specifiedterminal-u euid,...: Matches the specifiedeffective user id-U uid,...: Matches the specifiedreal user id- If no matching rule is specified, the default behavior is to match the process name
Examples:
pkill -9 -t pts/0pkill -9 -u user1
4.6 ps
Options:
a: All processes not associated with a terminalu: Processes related to the effective userx: Usually used together withato display more complete informationA/e: Displays all processes-f/-l: Detailed information; the content differs between the two-T/-L: Thread information; when used with-f/-l, the displayed details vary-o: Followed by comma-separated column names to specify which information to display%cpu%memargsuidpidppidlwp/tid/spid: ThreadTID,lwpstands for “light weight process”, i.e., a threadcomm/ucomm/ucmd: Thread nametimettyflags: Process flags1: Forked but didn’t exec4: Used super-user privileges
stat: Process statusD: uninterruptible sleep (usually IO)R: running or runnable (on run queue)S: interruptible sleep (waiting for an event to complete)T: stopped by job control signalt: stopped by debugger during the tracingW: paging (not valid since the 2.6.xx kernel)X: dead (should never be seen)Z: defunct (“zombie”) process, terminated but not reaped by its parent
-w: Wide output. Use this option twice for unlimited width.
Examples:
ps auxps -efps -efwwps -elps -e -o pid,ppid,stat | grep Z: Find zombie processesps -T -o tid,ucmd -p 212381: View all thread IDs and thread names of the specified process
4.7 pgrep
Pattern:
pgrep [-lon] <pattern>
Options:
-a: Lists the PID and the full program name-l: Lists the PID and the program name-f: Matches the full process name-o: Lists the oldest process-n: Lists the newest process
Examples:
pgrep sshdpgrep -l sshdpgrep -lo sshdpgrep -ln sshdpgrep -l ssh*pgrep -a sshd
4.8 pstree
Pattern:
pstree [-A|U] [-up]
Options:
-a: Displays the command-l: Does not truncate output-A: Connects process trees using ASCII characters (connection symbols are ASCII characters)-U: Connects process trees using UTF-8 characters, which may cause errors in some terminal interfaces (connection symbols are UTF-8 characters, smoother and more visually appealing)-p: Also lists the PID of each process-u: Also lists the account name each process belongs to-s: Displays the parent process of the specified process
Examples:
pstree: Displays the entire process treepstree -alps <pid>: Displays the process tree rooted at the specified<pid>
4.9 pstack
This command is used to view the stack of a specified process
Install:
1 | yum install -y gdb |
Examples:
1 | pstack 12345 |
4.10 prlimit
prlimit is used to get and set process resource limits.
Examples:
prlimit --pid=<PID> --core=<soft_limit>:<hard_limit>prlimit --pid=<PID> --core=unlimited:unlimited
4.11 taskset
This command is used to view or set the CPU affinity of a process
Pattern:
taskset [options] -p pidtaskset [options] -p [mask|list] pid
Options:
-c: Displays CPU affinity in list format-p: Specifies the PID of the process
Examples:
taskset -p 152694: View the CPU affinity of the process with PID152694, displayed as a masktaskset -c -p 152694: View the CPU affinity of the process with PID152694, displayed as a listtaskset -p f 152694: Set the CPU affinity of the process with PID152694using a masktaskset -c -p 0,1,2,3,4,5 152694: Set the CPU affinity of the process with PID152694using a list
What is a CPU affinity mask (hexadecimal)
cpu0 = 1cpu1 = cpu0 * 2 = 2cpu2 = cpu1 * 2 = 4cpu(n) = cpu(n-1) * 2mask = cpu0 + cpu1 + ... + cpu(n)- Some examples:
0 ==> 1 = 0x10,1,2,3 ==> 1 + 2 + 4 + 8 = 15 = 0xf0,1,2,3,4,5 ==> 1 + 2 + 4 + 8 + 16 + 32 = 0x3f2,3 ==> 4 + 8 = 12 = 0xc
4.12 su
su command is used to switch users
su: Switches to the root user in anon-login-shellmannersu -: Switches to the root user in alogin-shellmanner (changing directories, environment variables, etc.)su test: Switches to the test user in anon-login-shellmannersu - test: Switches to the test user in alogin-shellmanner (changing directories, environment variables, etc.)
Examples:
sudo su -sudo su - -c 'ls -al /'
4.13 sudo
sudo is used to execute a command as another user.
Note, sudo itself is a process. For example, using sudo tail -f xxx, in another session ps aux | grep tail will find two processes
Configuration file: /etc/sudoers
How to add sudoer privileges to the test user? Append the following content to /etc/sudoers (choose either one)
1 | # Execute sudo commands without a password |
Options:
-E: Indicates to the security policy that the user wishes to preserve their existing environment variables.-i, --login: Run login shell as the target user.
Examples:
sudo -u root ls /sudo -u root -E ls /sudo -i hdfs dfs -ls /
4.14 pkexec
This command is used to allow authorized users to execute programs as another user
Pattern:
pkexec [command]
4.15 nohup
nohup ignores all hangup (SIGHUP) signals. For example, when logging into a remote server via ssh and starting a program, that program will terminate once the ssh session ends. If started with nohup, the program will continue running even after logging out of ssh.
Pattern:
nohup command [args] [&]
Options:
command: The command to executeargs: Arguments required by the command&: Run in the background
Examples:
nohup java -jar xxx.jar &
4.16 screen
If you want a program to continue running after closing the ssh connection, you can use nohup. If you want to be able to check the status of the program started in a previous ssh session the next time you log in via ssh, then you need to use screen.
Pattern:
screenscreen cmd [ args ]screen [–ls] [-r pid]screen -X -S <pid> killscreen -d -m cmd [ args ]
Options:
cmd: The command to executeargs: Arguments required by the command-ls: Lists details of allscreensessions-r: Followed by apid, attaches to thescreensession with the specified process ID-d: Detaches from the current running session
Examples:
screenscreen -lsscreen -r 123
Session Management:
Ctrl a + w: Show the list of all windowsCtrl a + Ctrl a: Switch to the previously displayed windowCtrl a + c: Create a new window running a shell and switch to itCtrl a + n: Switch to the next windowCtrl a + p: Switch to the previous window (opposite ofCtrl a + n)Ctrl a + 0-9: Switch to window 0…9Ctrl a + d: Temporarily detach the screen sessionCtrl a + k: Kill the current window
4.17 tmux
tmux is like an advanced version of screen, for example, it allows features such as pair programming (allowing two terminals to enter the same tmux session, whereas screen does not allow this).
Usage:
tmux: Start a new session, named with an incrementing number.tmux new -s <name>: Start a new session with a specified name.tmux ls: List all sessions.tmux attach-session -t <name>: Attach to a session with a specific name.tmux kill-session -t <name>: Kill a session with a specific name.tmux rename-session -t <old-name> <new-name>: Rename a session.tmux source-file ~/.tmux.conf: Reload config.tmux clear-history: Clean history.tmux kill-server: Kill server.<prefix> ?: List key bindings.- Pane:
<prefix> ": Split pane vertically.<prefix> %: Split pane horizontally.<prefix> !: Break pane to a new window.<prefix> Up<prefix> Down<prefix> Left<prefix> Right<prefix> q: Prints the pane numbers and their sizes on top of the panes for a short time.<prefix> q <num>: Change to pane<num>.
<prefix> o: Move to the next pane by pane number.<prefix> <c-o>: Swaps that pane with the active pane.<prefix> E: Spread panes out evenly.<prefix> Spac: Select next layout.
- Window:
<prefix> <num>: Change to window<num>.<prefix> ': Prompt for a window index and changes to that window.<prefix> n: Change to the next window in the window list by number.<prefix> p: Change to the previous window in the window list by number.<prefix> l: Changes to the last window, which is the window that was last the current window before the window that is now.<prefix> w: Prints the window numbers for choose.
- Session:
<prefix> s: Prints the session numbers for choose.<prefix> $: Rename current session.<prefix> &: Kill current session.
- Pane:
- Options:
Session Optionstmux set-option -g <key> <value>/tmux set -g <key> <value>tmux show-options -g/tmux show-options -g <key>tmux set -g escape-time 50: Controls how long tmux waits to distinguish between an escape sequence (like a function key or arrow key) and a standalone Escape key press.
Window Optionstmux set-window-option -g <key> <value>/tmux setw -g <key> <value>tmux show-window-options -g/tmux show-window-options -g <key>tmux setw -g mode-keys vi: Use vi mode.tmux set-hook -g after-rename-window 'set -w allow-rename off'
Tips:
- In
tmux, vim’s color configuration may not work, so you need to set the environment variableexport TERM="xterm-256color". - Change the prefix key (the default prefix key is
C-b):- Method 1:
tmux set -g prefix C-x, only effective for the current session. - Method 2: Add the following configuration to
~/.tmux.conf:set -g prefix C-x.
- Method 1:
- Change the default shell:
- Method 1:
tmux set -g default-shell /usr/bin/zsh, only effective for the current session. - Method 2: Add the following configuration to
~/.tmux.conf:set -g default-shell /usr/bin/zsh.
- Method 1:
- Support scroll with mouse:
- Method 1:
tmux set -g mouse on, only effective for the current session. - Method 2: Add the following configuration to
~/.tmux.conf:set -g mouse on.
- Method 1:
My ~/.tmux.conf
1 | set -g prefix C-x |
4.18 reptyr
reptyr is used to reparent a specified process to the current terminal’s pid. Sometimes, when we ssh into a remote machine to run a command and later realize that the command will run for a long time but must disconnect the ssh session, we can open a new screen or tmux session and attach the target process to the new terminal.
Note: reptyr relies on the ptrace system call, which can be enabled by running echo 0 > /proc/sys/kernel/yama/ptrace_scope.
Examples:
reptyr <pid>
5 Network Management
5.1 netstat
Pattern:
netstat -[rn]netstat -[antulpc]
Options:
- Routing-related parameters
-r: List the routing table, functions likeroute-n: Do not use hostnames and service names; use IP addresses and port numbers, similar toroute -n
- Network interface-related parameters
-a: List all connection states, including tcp/udp/unix sockets, etc.-t: List only TCP packet connections-u: List only UDP packet connections-l: List only network states of services that are in Listen mode-p: List PID and program filename-c: Auto-update display every few seconds, e.g.,-c 5updates every 5 seconds
Explanation of routing-related display fields
Destination: Means networkGateway: The gateway IP of the interface; if 0.0.0.0, no extra IP is neededGenmask: The netmask; combined with Destination to define a host or networkFlags: Various flags indicating the meaning of the route or hostU: Route is usableG: Network requires forwarding via gatewayH: This route is for a host, not a whole networkD: Route created by redirect messageM: Route modified by redirect messageIface: Interface
Explanation of network interface-related display fields:
Proto: Packet protocol of the connection, mainly TCP/UDPRecv-Q: Total bytes copied from non-user program connectionsSend-Q: Bytes sent by remote host without ACK flag; also refers to bytes occupied by active connection SYN or other flag packetsLocal Address: Local endpoint address, can be IP or full hostname, formatted as “IP:port”Foreign Address: Remote host IP and port numberstat: Status barESTABLISHED: Connection establishedSYN_SENT: Sent an active connection (SYN flag) packetSYN_RECV: Received an active connection request packetFIN_WAIT1: Socket service interrupted, connection is closingFIN_WAIT2: Connection closed, waiting for remote host to acknowledge closeTIME_WAIT: Connection closed, socket waiting on network to finishLISTEN: Usually a service listening port; can be viewed with-l
The function of netstat is to check network connection status. The most common aspects are how many ports I have open waiting for client connections and the current state of my network connections, including how many are established or have issues.
Examples:
netstat -n | awk '/^tcp/ {++y[$NF]} END {for(w in y) print w, y[w]}'netstat -nlp | grep <pid>
5.2 tc
Traffic management is controlled by three types of objects: qdisc (queueing discipline), class, and filter.
Pattern:
tc qdisc [ add | change | replace | link ] dev DEV [ parent qdisc-id | root ] [ handle qdisc-id ] qdisc [ qdisc specific parameters ]tc class [ add | change | replace ] dev DEV parent qdisc-id [ classid class-id ] qdisc [ qdisc specific parameters ]tc filter [ add | change | replace ] dev DEV [ parent qdisc-id | root ] protocol protocol prio priority filtertype [ filtertype specific parameters ] flowid flow-idtc [-s | -d ] qdisc show [ dev DEV ]tc [-s | -d ] class show dev DEVtc filter show dev DEV
Options:
Examples:
tc qdisc add dev em1 root netem delay 300ms: Set network delay to 300mstc qdisc add dev em1 root netem loss 8% 20%: Set packet loss rate between 8% and 20%tc qdisc del dev em1 root: Delete the specified settings
5.3 ss
ss stands for Socket Statistics. As the name suggests, the ss command is used to obtain socket statistics information and can display content similar to netstat. The advantage of ss is that it can show more detailed information about TCP and connection states, and it is faster and more efficient than netstat.
When the number of socket connections on a server becomes very large, both the netstat command and directly using cat /proc/net/tcp become slow.
The secret to ss’s speed lies in its use of the tcp_diag module in the TCP protocol stack. tcp_diag is a module for analysis and statistics that can get first-hand information from the Linux kernel, ensuring that ss is fast and efficient.
Pattern:
ss [-talspnr]
Options:
-t: List tcp sockets-u: List udp sockets-a: List all sockets-l: List all listening sockets-e: Show detailed socket information, including inode number-s: Show summary information only-p: Show processes using the socket-n: Do not resolve service names-r: Resolve service names-m: Show memory usage-h: Show help documentation-i: Show tcp socket details
Examples:
ss -sss -t -a: Show all tcp socketsss -ti -a: Show all tcp sockets with detailsss -u -a: Show all udp socketsss -nlp | grep 22: Find the program that opened socket/port 22ss -o state established: Show all sockets in established statess -o state FIN-WAIT-1 dst 192.168.25.100/24: Show all sockets inFIN-WAIT-1state with destination network192.168.25.100/24ss -napss -nap -ess -naptu
5.4 ip
5.4.1 ip address
For detailed usage, refer to ip address help.
Scope:
scope host: The IP address is only valid within the host itself. Used for loopback addresses (like127.0.0.1or::1).scope link: The address is valid only on the local network link (i.e., same subnet). Common for IPv6 link-local addresses (fe80::/10).scope global: The address is globally routable, used to communicate over the Internet or across networks.
Examples:
ip addr showip -4 addr showip -6 addr show
ip addr show dev eth0ip -4 addr show dev eth0ip -6 addr show dev eth0
ip addr show scope globalip -4 addr show scope linkip -6 addr show scope host
5.4.2 ip link
For detailed usage, refer to ip link help
Examples:
ip link: View all network interfacesip link up: View interfaces in the up stateip -d link: View detailed informationip -d link show lo
ip link set eth0 up: Enable the network interfaceip link set eth0 down: Disable the network interfaceip link delete tunl0: Delete the network interfacecat /sys/class/net/xxx/carrier: Check if the network cable is plugged in (corresponds toip linkshowingstate UPorstate DOWN)
5.4.3 ip route
For detailed usage, refer to ip route help
5.4.3.1 Route Table
Linux supports up to 255 routing tables, each with a table id and table name. Among them, 4 tables are built into the Linux system:
table id = 0: Reserved by the systemtable id = 255: Local routing table, namedlocal. This table contains local interface addresses, broadcast addresses, and NAT addresses. It is automatically maintained by the system and cannot be modified directly by administrators.ip r show table local
table id = 254: Main routing table, namedmain. If no routing table is specified, all routes are placed here by default. Routes added by older tools likerouteare usually added here. Routes in themaintable are normal routing entries. When usingip routeto configure routes, if no table is specified, operations default to this table.ip r show table main
table id = 253: Default routing table, nameddefault. Default routes usually reside in this table.ip r show table default
Additional notes:
- Administrators can add custom routing tables and routes as needed.
- The mapping between
table idandtable namecan be viewed in/etc/iproute2/rt_tables. - When adding a new routing table, the administrator needs to add its
table idandtable namemapping in/etc/iproute2/rt_tables. - Routing tables are stored in memory and exposed to user space via the procfs filesystem at
/proc/net/route.
5.4.3.2 route type
unicast: Unicast routing is the most common type of routing in the routing table. This is a typical route to the destination network address, describing the path to the destination. Even complex routes (such as next-hop routes) are considered unicast routes. If the route type is not specified on the command line, the route is assumed to be a unicast route.
1 | ip route add unicast 192.168.0.0/24 via 192.168.100.5 |
broadcast: This route type is used for link-layer devices that support the concept of broadcast addresses (such as Ethernet cards). This route type is only used in the local routing table and is typically handled by the kernel.
1 | ip route add table local broadcast 10.10.20.255 dev eth0 proto kernel scope link src 10.10.20.67 |
local: When an IP address is added to an interface, the kernel adds an entry to the local routing table. This means the IP is locally hosted.
1 | ip route add table local local 10.10.20.64 dev eth0 proto kernel scope host src 10.10.20.67 |
nat: When a user attempts to configure stateless NAT, the kernel adds this route entry to the local routing table.
1 | ip route add nat 193.7.255.184 via 172.16.82.184 |
unreachable: When a request for a routing decision returns a route type indicating an unreachable destination, an ICMP unreachable message is generated and returned to the source address.
1 | ip route add unreachable 172.16.82.184 |
prohibit: When a routing request returns a destination with a prohibit route type, the kernel generates an ICMP prohibit message returned to the source address.
1 | ip route add prohibit 10.21.82.157 |
blackhole: Packets matching a route with the blackhole route type will be discarded. No ICMP is sent, and the packets are not forwarded.
1 | ip route add blackhole default |
throw: The throw route type is a convenient route type that causes the route lookup in the routing table to fail, thereby returning the routing process to the RPDB (Routing Policy Database). This is useful when there are other routing tables. Note that if there is no default route in the routing table, an implicit throw exists, so although it is valid, the route created by the first command in the example is redundant.
1 | ip route add throw default |
5.4.3.3 route scope
global: Globally valid
site: Valid only within the current site (IPv6)
link: Valid only on the current device
host: Valid only on the current host
5.4.3.4 route proto
proto: Indicates the timing of the route addition. It can be represented by a number or a string. The correspondence between numbers and strings can be found in /etc/iproute2/rt_protos.
redirect: Indicates that the route was added due to anICMPredirect.kernel: The route is automatically configured by the kernel during installation.boot: The route is installed during the boot process. If a routing daemon starts, it will clear these route rules.static: The route is installed by the administrator to override dynamic routes.
5.4.3.5 route src
This is considered a hint to the kernel (used to answer: if I want to send a packet to host X, which local IP should I use as the Source IP). This hint is about which IP address to select as the source address for outgoing packets on that interface.
5.4.3.6 Parameter Explanation
Explanation of the ip r show table local parameters (example below):
- The first field indicates whether the route is for a
broadcast address, anIP address, or anIP range, for example:local 192.168.99.35indicates anIP addressbroadcast 127.255.255.255indicates abroadcast addresslocal 127.0.0.0/8 devindicates anIP range
- The second field indicates through which device the route reaches the destination address, for example:
dev eth0 proto kerneldev lo proto kernel
- The third field indicates the scope of the route, for example:
scope hostscope link
- The fourth field indicates the source IP address of outgoing packets:
src 127.0.0.1
1 | ip route show table local |
5.4.4 ip rule
Policy-based routing is more powerful and flexible than traditional routing. It allows network administrators to select forwarding paths not only based on the destination address but also based on packet size, application, source IP address, and other attributes. Simply put, Linux systems have multiple routing tables, and routing policies direct routing requests to different tables based on certain conditions. For example, packets with source addresses in a certain range use routing table A, while other packets use another routing table. Such rules are controlled by routing policy rules.
In Linux, a routing policy rule mainly contains three pieces of information: the priority of the rule, the conditions, and the routing table. The lower the priority number, the higher the priority. Then, depending on which conditions are met, the specified routing table is used for routing. At Linux system startup, the kernel configures three default rules in the routing policy database: rule 0, rule 32766, and rule 32767 (the numbers indicate the rule priorities). Their specific meanings are as follows:
rule 0: Matches packets under any condition and looks up thelocalrouting table (table id = 255).rule 0is very special and cannot be deleted or overridden.rule 32766: Matches packets under any condition and looks up themainrouting table (table id = 254). System administrators can delete or override this rule with another policy.rule 32767: Matches packets under any condition and looks up thedefaultrouting table (table id = 253). This rule handles packets not matched by the previous default rules. This rule can also be deleted.
- In Linux, rules are matched sequentially according to their priority. Suppose the system only has the three rules with priorities
0,32766, and32767. The system first tries rule0to find routes in the local routing table. If the destination is in the local network or is a broadcast address, a matching route will be found here. If no route is found, it moves to the next non-empty rule — here, rule32766— to search the main routing table. If no matching route is found, it falls back to rule32767to look up the default routing table. If this also fails, routing fails.
Examples:
1 | # Add a rule that matches all packets and uses routing table 1; the rule priority is 32800 |
5.4.5 ip netns
1 | Usage: ip netns list |
Examples:
ip netns list: Lists network namespaces (only reads from/var/run/netns)ip netns exec test-ns ifconfig: Executesifconfiginside the network namespacetest-ns
Difference from nsenter: Since ip netns only reads network namespaces from /var/run/netns, while nsenter by default reads from /proc/${pid}/ns/net. However, Docker hides the container’s network namespace, meaning it does not create namespaces by default in the /var/run/netns directory. Therefore, to use ip netns to enter a container’s namespace, a symbolic link must be created.
1 | pid=$(docker inspect -f '{{.State.Pid}}' ${container_id}) |
5.5 iptables
5.5.1 Viewing Rules
Pattern:
iptables [-S] [-t tables] [-L] [-nv]
Options:
-S: Outputs the rules of the specified table; if no table is specified, outputs all rules, similar toiptables-save.-t: Specifies the table, such asnatorfilter. If omitted, the default isfilter.-L: Lists the rules of the current table.-n: Disables reverse lookup of IP and HOSTNAME, greatly speeding up the display.-v: Lists more information, including the total number of packets matched by the rule and related network interfaces.
Output Details:
- Each Chain represents a chain; the parentheses next to the Chain show the default policy (i.e., the action taken when no rules match — the target).
target: Represents the action to takeACCEPT: Allow the packetDROP: Discard the packetQUEUE: Pass the packet to userspaceRETURN: Stop traversing the current chain and resume at the next rule in the previous chain (e.g., ifChain AcallsChain B, afterChain B RETURNit continues with the next rule inChain A)- It can also be a custom Chain
port: Indicates the protocol used by the packet, mainly TCP, UDP, or ICMPopt: Additional option detailssource: The source IP the rule applies todestination: The destination IP the rule applies to
Examples:
iptables -nLiptables -t nat -nL
Since the above iptables commands only show formatted views, which may differ from the original rules in detail, it is recommended to use the command iptables-save to view firewall rules in detail.
Pattern:
iptables-save [-t table]
Options:
-t: Outputs rules for a specific table, e.g., only for NAT or Filter
Output Details:
- Lines starting with an asterisk (*) indicate the table, here it is Filter.
- Lines starting with a colon (😃 indicate chains; the 3 built-in chains followed by their policies.
- After the chain is
[Packets:Bytes], indicating the number of packets and bytes passed through that chain.
5.5.2 Clearing Rules
Pattern:
iptables [-t tables] [-FXZ] [chain]
Options:
-F [chain]: Flushes all specified rules in the given chain or all chains if none specified.-X [chain]: Deletes the specifieduser-defined chainor alluser-defined chainsif none specified.-Z [chain]: Zeroes the packet and byte counters for the specified chain or all chains if none specified.
5.5.3 Defining Default Policies
When a packet does not match any of the rules we set, whether the packet is accepted or dropped depends on the Policy setting.
Pattern:
iptables [-t nat] -P [INPUT,OUTPUT,FORWARD] [ACCEPT,DROP]
Options:
-P: Defines the policyACCEPT: The packet is acceptedDROP: The packet is dropped immediately, without notifying the client why it was dropped
Examples:
iptables -P INPUT DROPiptables -P OUTPUT ACCEPTiptables -P FORWARD ACCEPT
5.5.4 Basic Packet Matching: IP, Network, and Interface Devices
Pattern:
iptables [-t tables] [-AI chain] [-io ifname] [-p prop] [-s ip/net] [-d ip/net] -j [ACCEPT|DROP|REJECT|LOG]
Options:
-t tables: Specifies the tables, the default table isfilter.-AI chain: Insert or append rules for a specific chain.-A chain: Append a new rule at the end of existing rules. For example, if there are 4 rules,-Aadds a fifth.-I chain [rule num]: Insert a rule at a specified position. If no position is specified, it inserts as the first rule.chain: Can be a built-in chain (INPUT,OUTPUT,FORWARD,PREROUTING,POSTROUTING) or a user-defined chain.
-io ifname: Specify input/output network interfaces for packets.-i: The incoming network interface for the packet, e.g., eth0, lo; used with the INPUT chain.-o: The outgoing network interface for the packet; used with the OUTPUT chain.
-p prop: Specifies the packet protocol the rule applies to.- Common protocols include: tcp, udp, icmp, and all.
-s ip/net: Specifies the source IP or network for packets that match this rule.ip: e.g.,192.168.0.100net: e.g.,192.168.0.0/24or192.168.0.0/255.255.255.0- To negate, add
!, e.g.,! -s 192.168.100.0/24
-d ip/net: Same as-s, but for destination IP or network.-j target: Specifies the target action.ACCEPTDROPQUEUERETURN- Other Chains
- Matching works like a function call stack: jumping between chains is like function calls. Some targets stop matching (e.g.,
ACCEPT,DROP,SNAT,MASQUERADE), others continue (e.g., jumping to anotherChain,LOG,ULOG,TOS).
- Important principle: If an option is not specified, it means that condition is fully accepted.
- For example, if
-sand-dare not specified, it means any source or destination IP/network is accepted.
- For example, if
Examples:
iptables -A INPUT -i lo -j ACCEPT: Accept packets from any source or destination as long as they come through thelointerface—this is called a trusted device.iptables -A INPUT -i eth1 -j ACCEPT: Adds the interfaceeth1as a trusted device.iptables -A INPUT -s 192.168.2.200 -j LOG: Logs packets from this source IP to the kernel log file (e.g.,/var/log/messages), then continues to match further rules (different from most rules).- Logging rules (should be placed first, otherwise if other rules match first, these won’t execute):
iptables -I INPUT -p icmp -j LOG --log-prefix "liuye-input: "iptables -I FORWARD -p icmp -j LOG --log-prefix "liuye-forward: "iptables -I OUTPUT -p icmp -j LOG --log-prefix "liuye-output: "iptables -t nat -I PREROUTING -p icmp -j LOG --log-prefix "liuye-prerouting: "iptables -t nat -I POSTROUTING -p icmp -j LOG --log-prefix "liuye-postrouting: "
5.5.5 Rules for TCP and UDP: Port-based Rules
TCP and UDP are special because of ports, and for TCP there is also the concept of connection packet states, including the common SYN active connection packet format.
Pattern:
iptables [-AI chain] [-io network interface] [-p tcp|udp] [-s source IP/network] [--sport source port range] [-d destination IP/network] [--dport destination port range] --syn -j [ACCEPT|DROP|REJECT]
Options:
--sport port range: Restricts the source port number; port ranges can be continuous, e.g., 1024:65535.--dport port range: Restricts the destination port number.--syn: Indicates an active connection (SYN flag).- Compared to previous commands, these add the
--sportand--dportoptions, so you must specify-p tcpor-p udpto use them.
Examples:
iptables -A INPUT -i eth0 -p tcp --dport 21 -j DROP: Blocks all packets trying to enter the machine on port 21.iptables -A INPUT -i eth0 -p tcp --sport 1:1023 --dport 1:1023 --syn -j DROP: Drops active connections from any source port 1-1023 to destination ports 1-1023.
5.5.6 iptables Matching Extensions
iptables can use extended packet matching modules. When specifying -p or --protocol, or using the -m or --match option followed by the name of the matching module, various additional command line options can be used depending on the specific module. Multiple extended match modules can be specified on a single line, and after specifying a module, you can use -h or --help to get module-specific help documentation (e.g., iptables -m comment -h will show parameters for the comment module at the bottom of the output).
Common Modules, for detailed information please refer to Match Extensions:
comment: Adds commentsconntrack: When used with connection tracking, this module allows access to more connection tracking information than the “state” match. (This module exists only if iptables is compiled with support for this feature in the kernel.)tcpudp
5.5.7 iptables Target Extensions
iptables can use extended target modules, and after specifying a target, you can use -h or --help to get target-specific help documentation (e.g., iptables -j DNAT -h).
Common targets (can be found by running man iptables or man 8 iptables-extensions and searching for the keyword target):
ACCEPTDROPRETURNREJECTDNATSNATMASQUERADE: Used to implement automatic SNAT. If the outbound IP changes frequently, this target can be used to achieve SNAT.
5.5.8 ICMP Packet Rules Comparison: Designed to Control Ping Responses
Pattern:
iptables -A INPUT [-p icmp] [--icmp-type 类型] -j ACCEPT
Options:
--icmp-type: Must be followed by the ICMP packet type, which can also be specified by a code.
5.6 bridge
5.6.1 bridge link
Bridge port
Examples:
bridge link show
5.6.2 bridge fdb
Forwarding Database entry
Examples:
bridge fdb show
5.6.3 bridge mdb
Multicast group database entry
5.6.4 bridge vlan
VLAN filter list
5.6.5 bridge monitor
5.7 route
Pattern:
route [-nee]route add [-net|-host] [网络或主机] netmask [mask] [gw|dev]route del [-net|-host] [网络或主机] netmask [mask] [gw|dev]
Options:
-n: Do not resolve protocol or hostname, use IP or port number directly. By default,routetries to resolve the hostname of the IP, which may cause delays if it fails to resolve, so this option is generally added.-ee: Display more detailed information.-net: Indicates that the following route is for a network.-host: Indicates that the following route is for a single host.netmask: Related to the network, used to set the netmask to determine the size of the network.gw: Abbreviation for gateway, followed by an IP address.dev: If you just want to specify which network interface card to use for outgoing connection, use this setting followed by the interface name, e.g.,eth0.
Explanation of print parameters:
- Destination, Genmask: These two parameters correspond to the network and netmask respectively.
- Gateway: Indicates through which gateway the network is connected. If it shows
0.0.0.0 (default), it means the route sends packets directly on the local network via MAC addresses. If an IP is shown, it means the route requires a router (gateway) to forward packets. - Flags:
U (route is up): The route is active.H (target is a host): The destination is a single host, not a network.G (use gateway): Requires forwarding packets through an external host (gateway).R (reinstate route for dynamic routing): Flag indicating reinstatement of route during dynamic routing.D (Dynamically installed by daemon or redirect): Dynamically installed route.M (modified from routing daemon or redirect): Route has been modified.! (reject route): This route will not be accepted.
- Iface: The interface used to transmit packets for this route.
Examples:
route -nroute add -net 169.254.0.0 netmask 255.255.0.0 dev enp0s8route del -net 169.254.0.0 netmask 255.255.0.0 dev enp0s8
5.8 nsenter
nsenter is used to execute a command within a specific network namespace. For example, some Docker containers do not have the curl command, but you may want to run it inside the Docker container’s environment. In this case, you can use nsenter on the host machine.
Pattern:
nsenter -t <pid> -n <cmd>
Options:
-t: followed by the process ID-n: followed by the command to execute
Examples:
nsenter -t 123 -n curl baidu.com
5.9 tcpdump
Options:
-A: Print each packet (minus its link level header) in ASCII. Handy for capturing web pages.-e: Print the link-level header on each dump line. This can be used, for example, to print MAC layer addresses for protocols such as Ethernet and IEEE 802.11.-n: Don’t convert addresses (i.e., host addresses, port numbers, etc.) to names.-q: Quick (quiet?) output. Print less protocol information so output lines are shorter.-i <interface>: Listen, report the list of link-layer types, report the list of time stamp types, or report the results of compiling a filter expression on interface.-w <file>: Write the raw packets to file rather than parsing and printing them out.-r <file>: Read packets from file (which was created with the -w option or by other tools that write pcap or pcapng files). Standard input is used if file is-.-c <count>: Exit after receiving count packets.-vv/-vvv: Even more verbose output.-t: Don’t print a timestamp on each dump line.-tt: Print the timestamp, as seconds since January 1, 1970, 00:00:00, UTC, and fractions of a second since that time, on each dump line.-ttt: Print a delta (microsecond or nanosecond resolution depending on the --time-stamp-precision option) between current and previous line on each dump line. The default is microsecond resolution.-tttt: Print a timestamp, as hours, minutes, seconds, and fractions of a second since midnight, preceded by the date, on each dump line.-ttttt: Print a delta (microsecond or nanosecond resolution depending on the --time-stamp-precision option) between current and first line on each dump line. The default is microsecond resolution.
Output columns specification:
src > dst: Flags data-seqno ack window urgent optionssrc: Sourceip/port(or domain)dst: Destip/port(or domain)FlagsS:SYNCF:FINP:PUSHR:RSTU:URGW:ECN CWRE:ECN-Echo.:ACKnone
data-seqno: The sequence number of the data packet, which can be one or more (1:4)ack: Indicates the sequence number of the next expected data packetwindow: The size of the receive bufferurgent: Indicates whether the current data packet contains urgent dataoption: The part enclosed in[]
Examples:
tcpdump -i lo0 port 22 -w output7.captcpdump -i eth0 host www.baidu.comtcpdump -i any -w output1.captcpdump -n -i any -e icmp and host www.baidu.com
5.9.1 tcpdump Conditional Expressions
This expression is used to determine which packets will be printed. If no condition expression is given, all packets captured on the network will be printed; otherwise, only packets that satisfy the condition expression will be printed.
The expression consists of one or more primitives (primitives, which can be understood as the basic elements of an expression). A primitive usually consists of one or more modifiers called qualifiers followed by an id, which is represented by a name or number (i.e., qualifiers id). There are three different types of qualifiers: type, direction, and protocol.
Primitive Format: [protocol] [direction] [type] id
- type: Includes
host,net,port,portrange. The default value ishost. - direction: Includes
src,dst,src and dst,src or dstas the four possible directions. The default value issrc or dst. - protocol: Includes
ether,fddi,tr,wlan,ip,ip6,arp,rarp,decnet,tcp,udp, etc. By default, all protocols are included.- The
protocolmust match thetype. For example, whenprotocolistcp, thetypecannot behostornet, but should beportorportrange.
- The
- Logical Operations: A
condition expressioncan be composed of multipleprimitivescombined usinglogical operations. The logical operations include!ornot,&&orand, and||oror.
Examples:
tcp src port 123tcp src portrange 100-200host www.baidu.com and port 443
5.9.2 tips
How to view a specific protocol, for example, the SSH protocol
Use Wireshark
- Select any packet with a
lengthnot equal to0, right-click and choose “Decode As”, then in the right-sideCurrentcolumn, select the corresponding protocol.
5.9.3 How to Use tcpdump to Capture HTTP Protocol Data from docker
Docker uses a Unix domain socket, corresponding to the socket file /var/run/docker.sock. Since domain sockets do not go through the network interface, tcpdump cannot directly capture the related data.
Method 1: Change the client’s access method
1 | # In terminal 1, listen on local port 18080 and forward the traffic to Docker's domain socket |
Method 2: Do not change the client’s access method
1 | # In terminal 1, run the `mv` command to rename the original domain socket file. This operation does not change the file descriptor, so after moving, Docker listens on the socket `/var/run/docker.sock.original` |
5.10 tcpflow
tcpflow is a command-line tool used to capture and analyze network traffic, specifically Transmission Control Protocol (TCP) connections. It is often used by network administrators and developers for debugging and monitoring network communication.
Key Features of tcpflow:
- Capture TCP Streams:
tcpflowcaptures and records data transmitted in TCP connections. Unlike packet capture tools liketcpdump, which show individual packets,tcpflowreconstructs and displays the actual data streams as they appear at the application layer. - Session Reconstruction: It organizes captured data by connection, storing the data streams in separate files or displaying them on the console. This allows for easy inspection of the content exchanged during a session.
- Readable Output: The tool provides human-readable output by reconstructing the sequence of bytes sent in each TCP connection, making it easier to analyze protocols and troubleshoot issues.
- Filtering: Similar to tools like
tcpdump,tcpflowcan filter traffic based on criteria like source/destination IP addresses, ports, or other protocol-level details
Examples:
tcpflow -i eth0tcpflow -i any host www.google.com
5.11 tcpkill
tcpkill is used to kill TCP connections, and its syntax is basically similar to tcpdump. Its working principle is quite simple: it first listens to the relevant packets, obtains the sequence number, and then sends a Reset packet. Therefore, tcpkill only works when there is packet exchange in the connection.
Install:
1 | # Install yum repo |
Pattern:
tcpkill [-i interface] [-1...9] expression
Options:
-i: specify the network interface-1...9: priority level; the higher the priority, the easier it is to kill the connectionexpression: filter expression, similar to tcpdump
Examples:
tcpkill -9 -i any host 127.0.0.1 and port 22
5.12 socat
Pattern:
socat [options] <address> <address>- The two
addressarguments are the key. Anaddressis similar to a file descriptor. Socat works by creating apipebetween the two specifiedaddressdescriptors for sending and receiving data.
Options:
address: can be one of the following forms-: represents standard input/output/var/log/syslog: can be any file path; if relative, use./to open a file as a data streamTCP:127.0.0.1:1080: establish a TCP connection as a data stream (TCP can be replaced by UDP)TCP-LISTEN:12345: create a TCP listening port (TCP can be replaced by UDP)EXEC:/bin/bash: execute a program as a data stream
Examples:
socat - /var/www/html/flag.php: read a file via Socat, absolute pathsocat - ./flag.php: read a file via Socat, relative pathecho "This is Test" | socat - /tmp/hello.html: write to a filesocat TCP-LISTEN:80,fork TCP:www.baidu.com:80: forward local port to remotesocat TCP-LISTEN:12345 EXEC:/bin/bash: open a shell proxy locally
5.13 dhclient
Pattern:
dhclient [-dqr]
Options:
-d: always run the program in the foreground-q: quiet mode, do not print any error messages-r: release the IP address
Examples:
dhclient: obtain an IP addressdhclient -r: release the IP address
5.14 arp
Examples:
arp: view the ARP cachearp -n: view the ARP cache, display IP addresses without domain namesarp 192.168.56.1: view the MAC address of the IP192.168.56.1
5.15 arp-scan
Install:
1 | yum install -y git |
Examples:
arp-scan -larp-scan 10.0.2.0/24arp-scan -I enp0s8 -larp-scan -I enp0s8 192.168.56.1/24
5.16 ping
Options:
-c: followed by the number of packets to send-s: specify the size of the data-M [do|want|dont]: set the MTU strategy, wheredomeans do not allow fragmentation;wantmeans allow fragmentation when the packet is large;dontmeans do not set theDF(Don’t Fragment) flag
Examples:
ping -c 3 www.baidu.comping -s 1460 -M do baidu.com: send packets with a size of 1460 (+28) bytes and forbid fragmentation
5.17 arping
Pattern:
arping [-fqbDUAV] [-c count] [-w timeout] [-I device] [-s source] destination
Options:
-c: specify the number of packets to send-b: continuously send requests using broadcast-w: specify the timeout duration-I: specify which Ethernet device to use-D: enable address conflict detection mode
Examples:
arping -c 1 -w 1 -I eth0 -b -D 192.168.1.1: this command can be used to detect if there is an IP conflict in the local network- If this command returns 0: it means no conflict exists; otherwise, a conflict exists
Why can the -D option detect IP conflicts
- Environment description:
- Machine A, IP:
192.168.2.2/24, MAC address:68:ed:a4:39:92:4b - Machine B, IP:
192.168.2.2/24, MAC address:68:ed:a4:39:91:e6 - Router, IP:
192.168.2.1/24, MAC address:c8:94:bb:af:bd:8c
- Machine A, IP:
- When running
arping -c 1 -w 1 -I eno1 -b 192.168.2.2on Machine A, and capturing packets on both Machine A and Machine B, the capture results are as follows: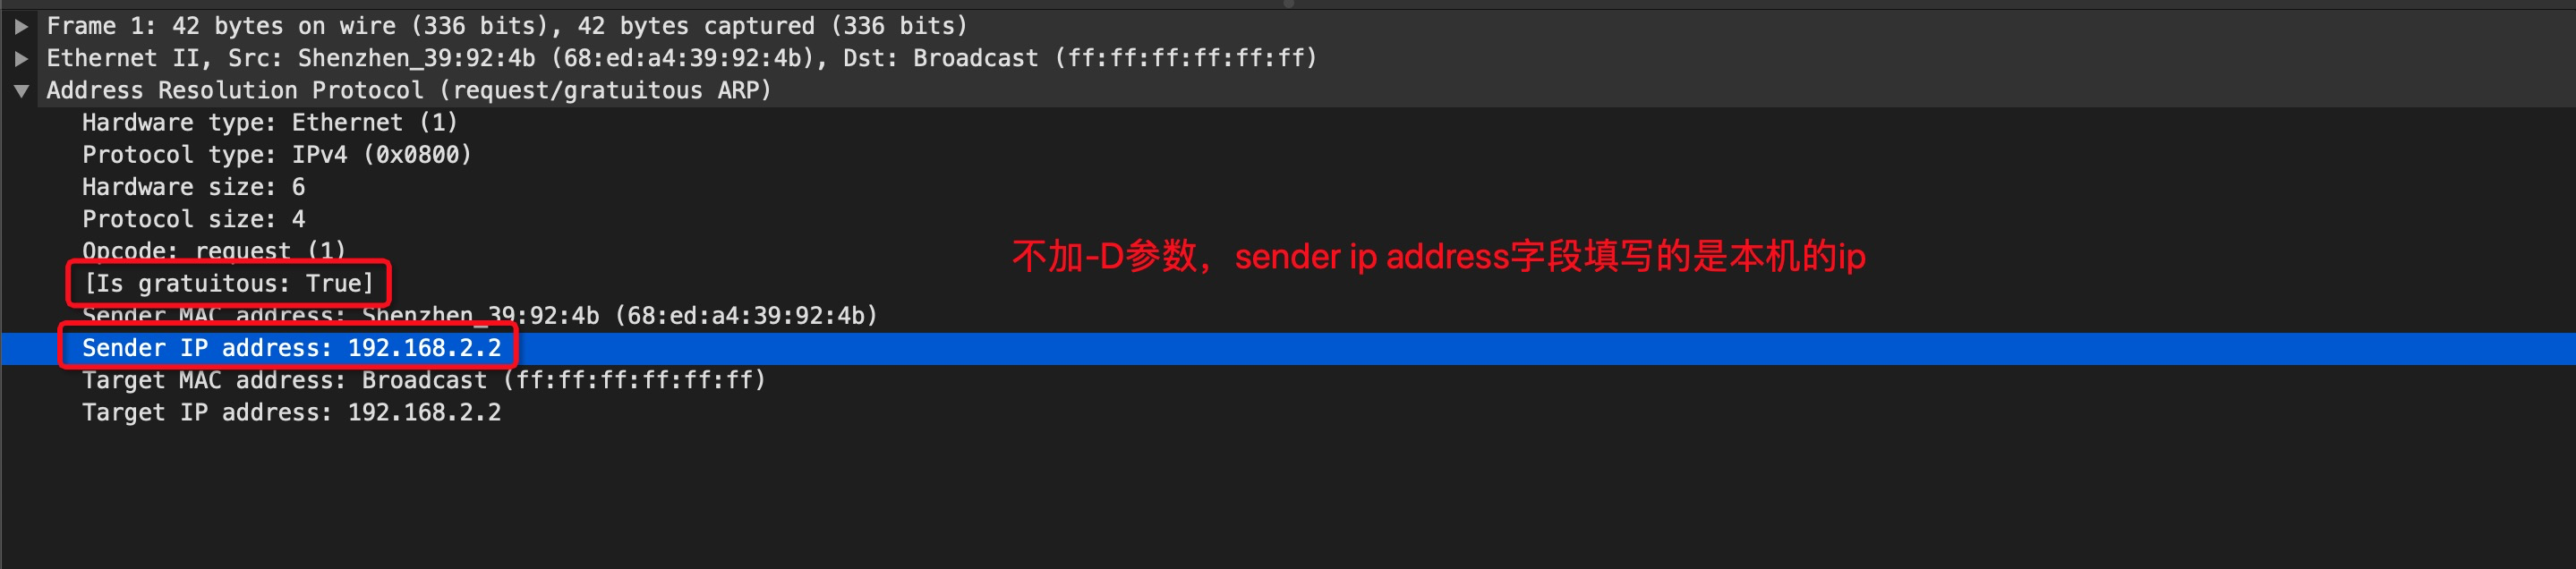
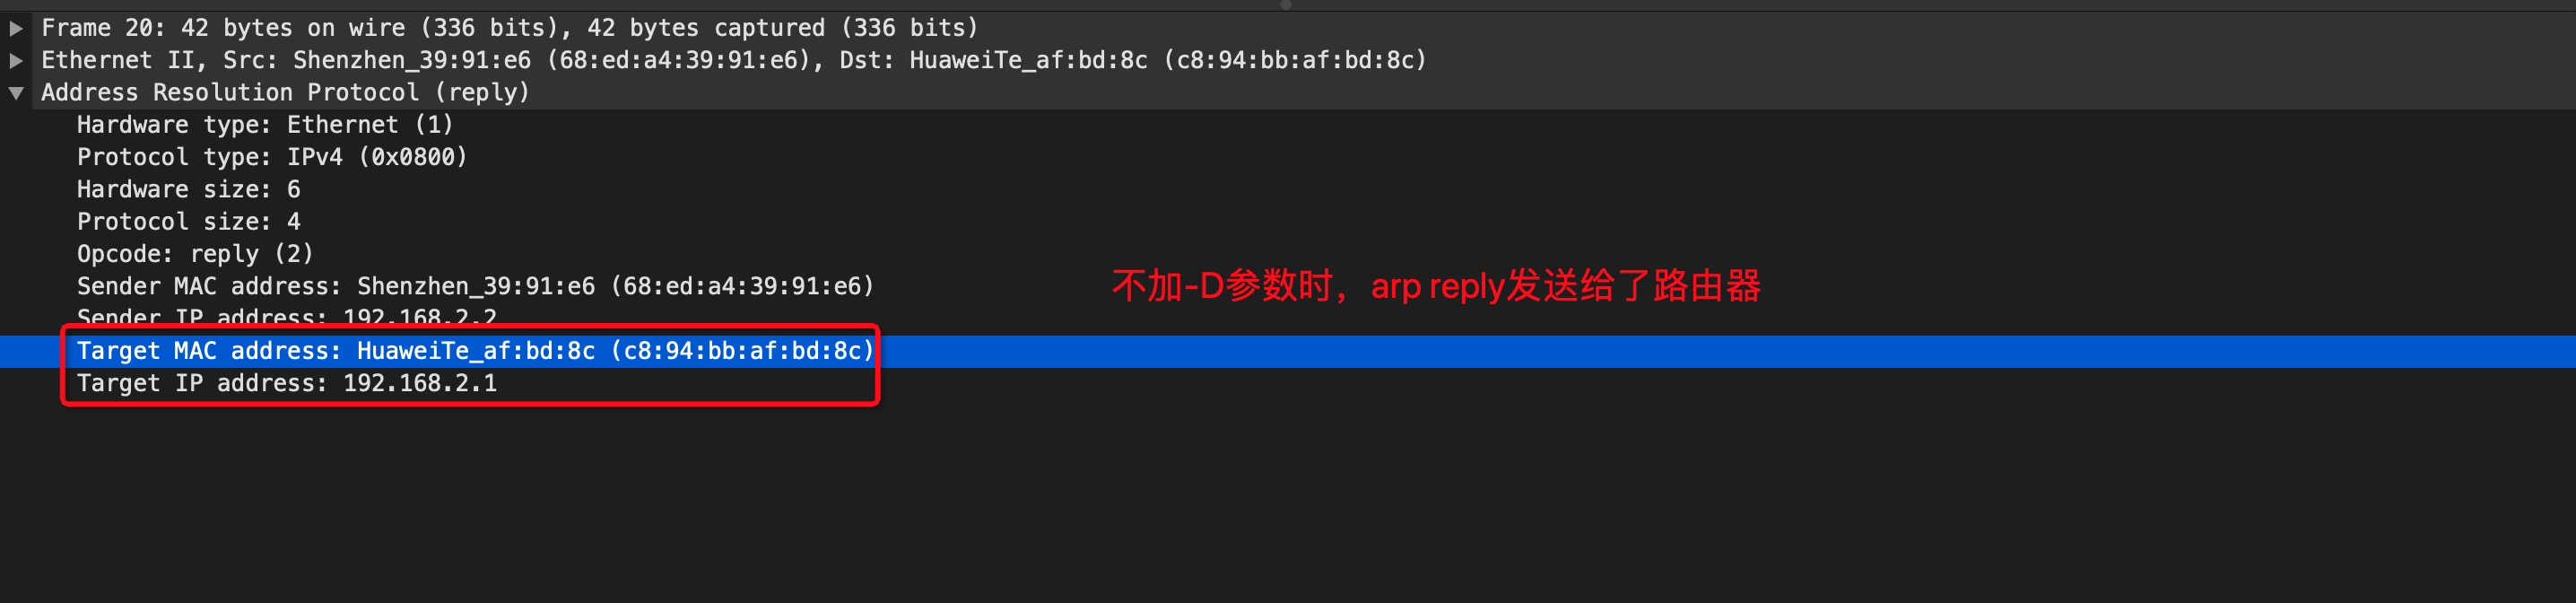
- After the ARP reply is sent to the router, the router does not know which device to forward the packet to, so it simply discards it
- When running
arping -c 1 -w 1 -I eno1 -D -b 192.168.2.2on Machine A, and capturing packets on both Machine A and Machine B, the capture results are as follows: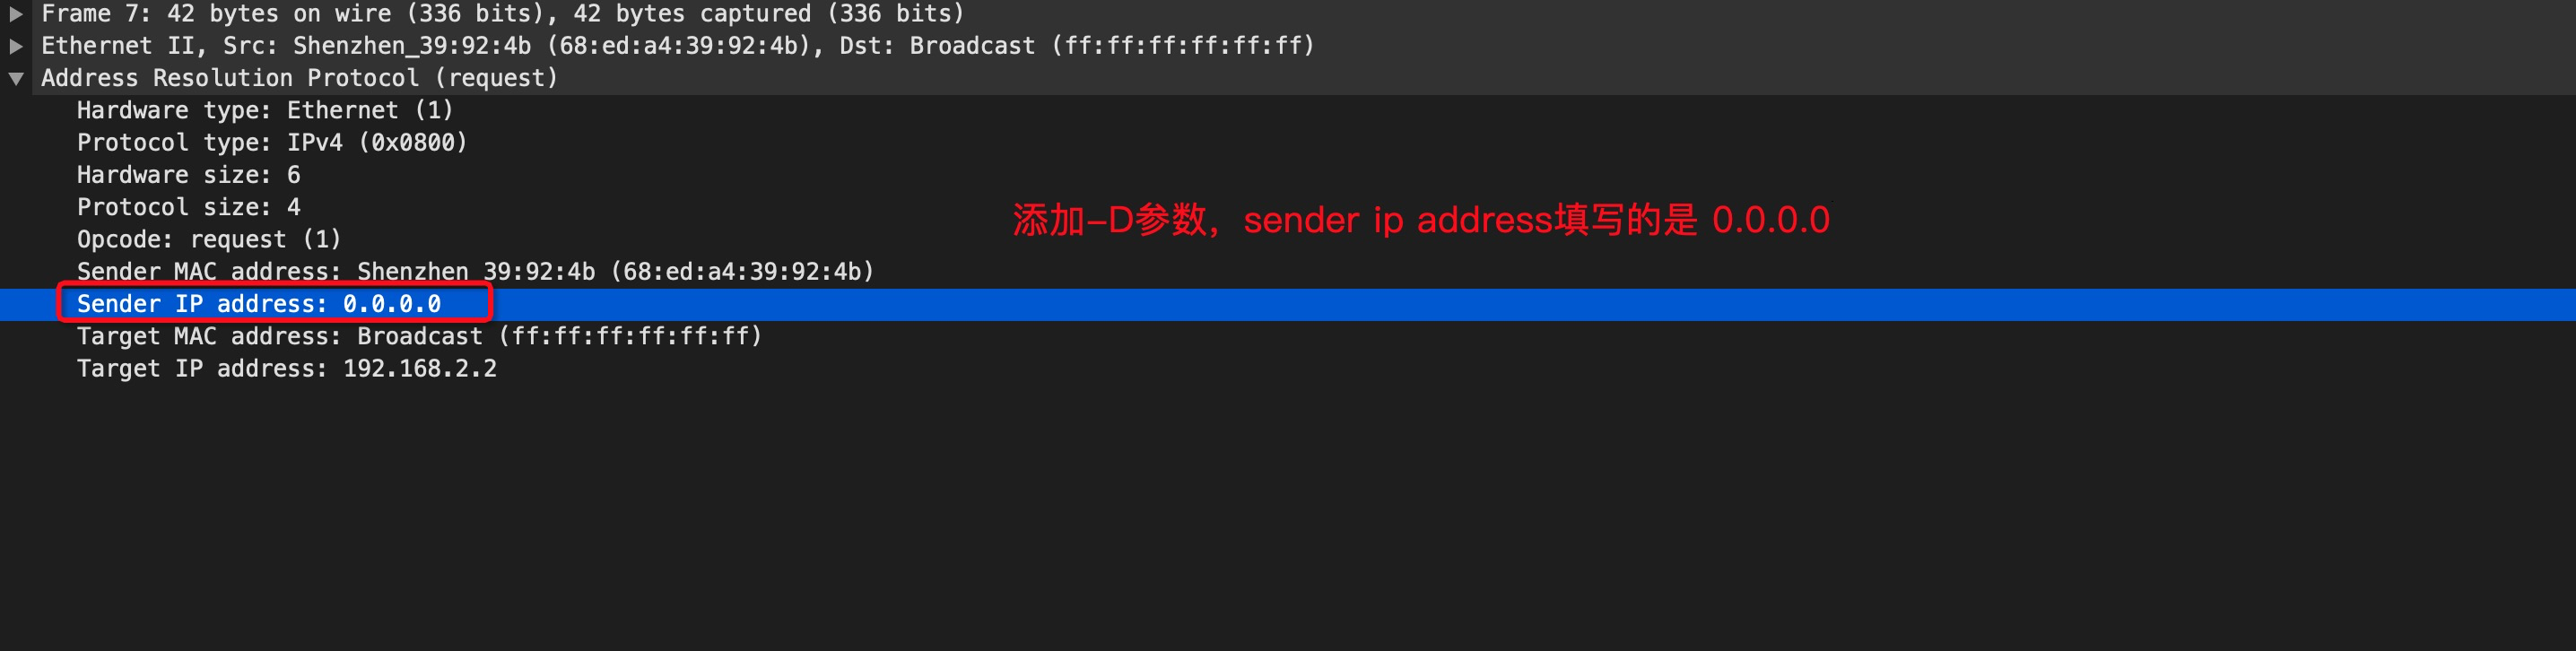
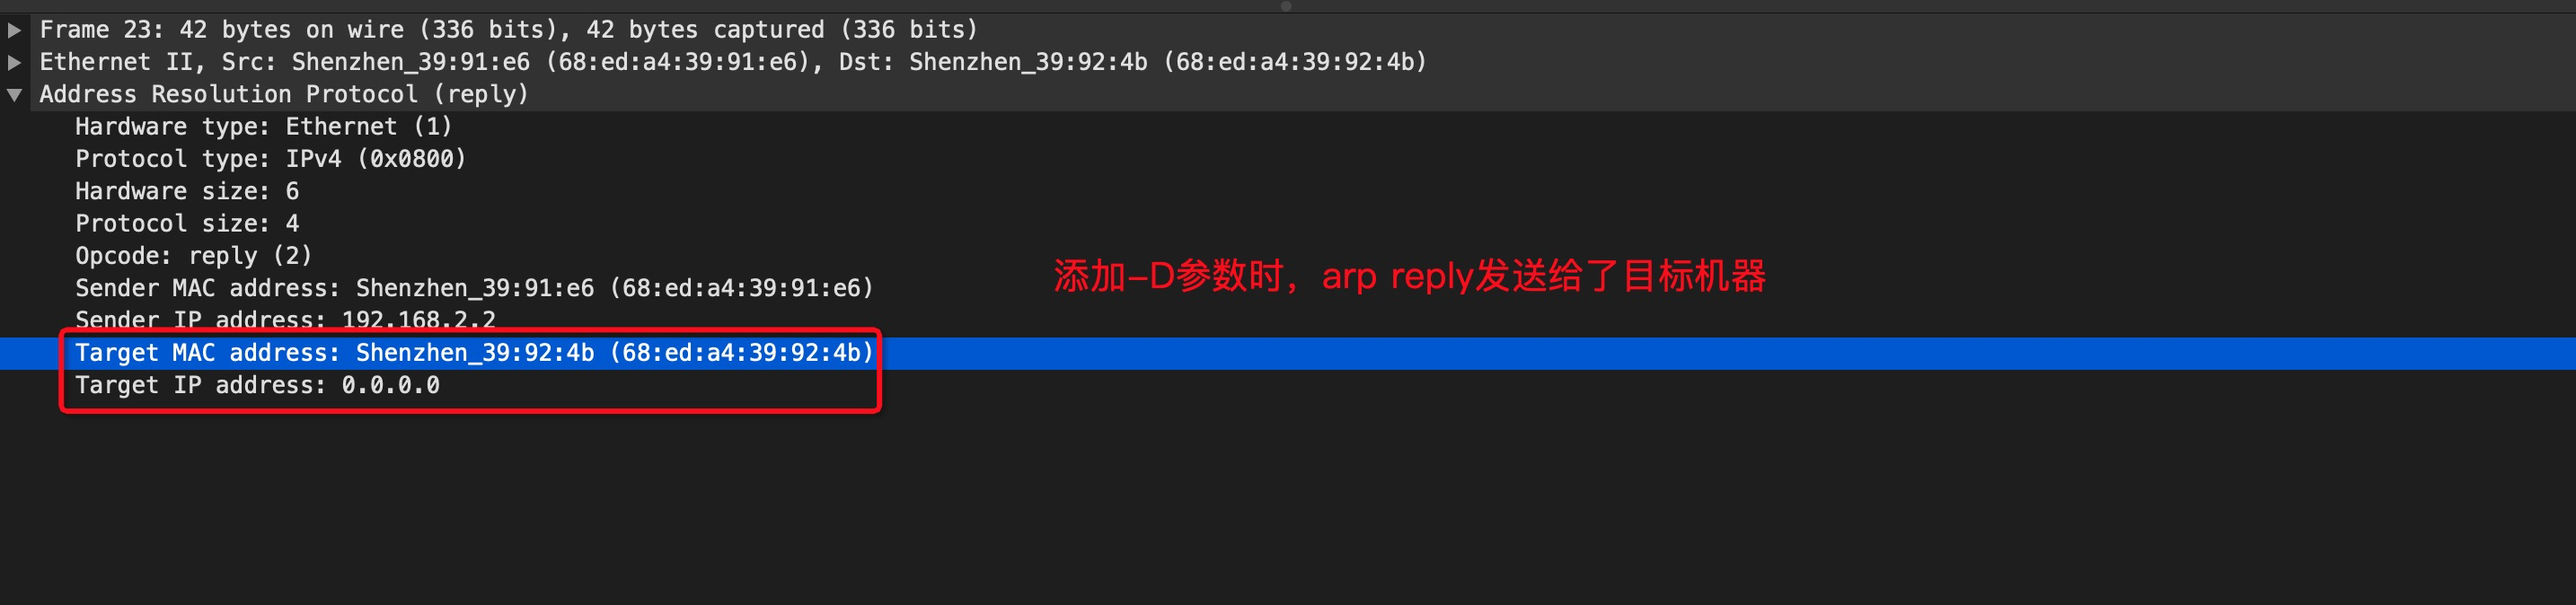
- The ARP reply directly specifies the target machine’s MAC address, so it is delivered directly to Machine A
5.18 hping3
Install:
1 | # Install yum repo |
Options:
-c: Number of packets to send and receive (if only sending packets without receiving, it will not stop)-d: Specify packet size (excluding header)-S: Send only SYN packets-w: Set TCP window size-p: Destination port--flood: Flood mode, sending packets as fast as possible--rand-source: Use random IP as source IP
Examples:
hping3 -c 10000 -d 120 -S -w 64 -p 21 --flood --rand-source www.baidu.com
5.19 iperf
Network testing tool, generally used for LAN testing. Internet speed test: speedtest
Examples:
- IPv4
iperf -s -p 3389 -i 1: Serveriperf -c <server_addr> -p 3389 -i 1: Client
- IPv6
iperf3 -s -6 -p 3389 -i 1: Serveriperf3 -c <server_addr> -p 3389 -6 -i 1: Client
5.20 nc
Examples:
nc -zv 127.0.0.1 22: Test connectivity.
6 Monitoring
6.1 ssh
Pattern:
ssh [-f] [-o options] [-p port] [account@]host [command]
Options:
-f: Used with the following [command], it sends a command to the remote host without logging in-o: Followed byoptionsConnectTimeout=<seconds>: Number of seconds to wait for a connection, reduces wait timeStrictHostKeyChecking=[yes|no|ask]: Default is ask; to automatically add a public key to known_hosts, set it to no
-p: Followed by a port number; if the sshd service runs on a non-standard port, this option is needed
Examples:
ssh 127.0.0.1: Since no username is provided, the current user’s account is used to log in to the remote serverssh student@127.0.0.1: The account is for the host at this IP, not a local accountssh student@127.0.0.1 find / &> ~/find1.logssh -f student@127.0.0.1 find / &> ~/find1.log: Logs out of 127.0.0.1 immediately;findruns on the remote serverssh demo@1.2.3.4 '/bin/bash -l -c "xxx.sh"': Logs into the remote using alogin shelland executes the script; the-largument tobashspecifies login shell mode- It’s best to wrap the whole command in quotes, otherwise arguments in complex commands may fail to parse, for example:
1
2
3
4
5
6
# The -al argument will be lost
ssh -o StrictHostKeyChecking=no test@1.2.3.4 /bin/bash -l -c 'ls -al'
# The -al argument is passed correctly
ssh -o StrictHostKeyChecking=no test@1.2.3.4 "/bin/bash -l -c 'ls -al'"
# When using eval, quotes are also needed, and must be escaped
eval "ssh -o StrictHostKeyChecking=no test@1.2.3.4 \"/bin/bash -l -c 'ls -al'\""
- It’s best to wrap the whole command in quotes, otherwise arguments in complex commands may fail to parse, for example:
6.1.1 Passwordless Login
Method 1 (Manual):
1 | # Create an RSA key pair (if one doesn't already exist) |
Method 2 (Automatic, ssh-copy-id)
1 | # Create an RSA key pair (if one doesn't already exist) |
6.1.2 Disable Password Login
Modify /etc/ssh/sshd_config
1 | PasswordAuthentication no |
6.1.3 Prevent Disconnection Due to Inactivity
Modify /etc/ssh/sshd_config, it is worked on SSH-level. And there’s another config named TCPKeepAlive, which is worked on TCP-level.
1 | ClientAliveInterval 60 |
6.1.4 Tunnels
Pattern:
ssh -L [local_bind_addr:]local_port:remote_host:remote_port [-fN] middle_hostlocalcommunicates withmiddle_hostmiddle_hostcommunicates withremote_host(of course,remote_hostcan be the same asmiddle_host)- Path:
frontend --tcp--> local_host:local_port --tcp over ssh--> middle_host:22 --tcp--> remote_host:remote_port
Options:
-f: Run in the background-N: Do not execute remote commands
Examples:
ssh -L 5901:127.0.0.1:5901 -N -f user@remote_host: Listens only on127.0.0.1ssh -L "*:5901:127.0.0.1:5901" -N -f user@remote_host: Listens on all IPs- Same as
ssh -g -L 5901:127.0.0.1:5901 -N -f user@remote_host
- Same as
6.1.5 WARNING: REMOTE HOST IDENTIFICATION HAS CHANGED
When the RSA fingerprint of the remote machine changes, the above error message will appear when trying to ssh again. There are two ways to fix this:
- Delete the entry related to the specified
hostname or IPfrom.ssh/known_hosts - Use
ssh-keygento remove the entry related to the specifiedhostname or IPfrom.ssh/known_hosts1
2# If the -f option is not used, it will modify the .ssh/known_hosts file for the current user by default
ssh-keygen -f "/Users/hechenfeng/.ssh/known_hosts" -R "<hostname or IP>"
6.1.6 Specify Password
1 | sshpass -p 'xxxxx' ssh -o StrictHostKeyChecking=no test@1.2.3.4 |
6.2 scp
Pattern:
scp [-pPr] [-l <rate>] local_file [account@]host:dirscp [-pPr] [-l <rate>] [account@]host:file local_dir
Options:
-p: Preserve the source file’s permission information-P: Specify the port number-r: When the source is a directory, recursively copy the entire directory (including subdirectories)-l: Limit the transfer rate, unit is Kbits/s
Examples:
scp /etc/hosts* student@127.0.0.1:~scp /tmp/Ubuntu.txt root@192.168.136.130:~/Desktopscp -P 16666 root@192.168.136.130:/tmp/test.log ~/Desktop: Specify port number 16666 for host192.168.136.130scp -r local_folder remote_username@remote_ip:remote_folder
6.3 watch
Pattern:
watch [option] [cmd]
Options:
-n: Whenwatchis used without this parameter, it runs the program every 2 seconds by default. Use-nor--intervalto specify a different interval time-d:watchwill highlight areas that have changed. The-d=cumulativeoption highlights all areas that have changed at any time (regardless of whether they changed in the most recent update)-t: Disable the header showing interval and current time at the top of thewatchoutput
Examples:
watch -n 1 -d netstat -ant: Every second, highlight changes in network connection countswatch -n 1 -d 'pstree | grep http': Every second, highlight changes in the number of HTTP connectionswatch 'netstat -an | grep :21 | grep <ip> | wc -l': Monitor in real-time the number of connections established by a simulated attack clientwatch -d 'ls -l | grep scf': Monitor changes in files containingscfin the current directorywatch -n 10 'cat /proc/loadavg': Output the system’s load average every 10 seconds
6.4 top
Pattern:
top [-H] [-p <pid>]
Options:
-H: Show threads-p: View a specified process-b: Non-interactive mode, typically used with-nto specify the number of iterations
Examples:
top -p 123: View the process with PID 123top -Hp 123: View the process with PID 123 and all its threadstop -b -n 3: Run in batch mode and update 3 times
Output Description:
- First line:
- Current time
- Uptime
- Number of logged-in users
- System load averages over 1, 5, and 15 minutes
- Second line: Total number of processes and counts in various states
- Third line: CPU usage; note that
wa(I/O wait) is important—highwaoften indicates I/O bottlenecks - Fourth and fifth lines: Physical and virtual memory usage; the less swap used, the better—high swap usage means insufficient physical memory
- Sixth line: The command input area in
topinteractive mode - Seventh line and onward: Per-process resource usage
PID: Process IDUSER: User who owns the processPR: Priority (lower is higher priority)NI: Nice value (affects priority; lower is higher priority)%CPU: CPU usage%MEM: Memory usageTIME+: Cumulative CPU time usedCOMMAND: Command name
- By default, top sorts by CPU usage. Press
hfor help. - Sorting keys:
P: Sort by CPU usage (default descending, pressRto reverse)M: Sort by memory usageT: Sort by time used
- Other interactive commands:
1: Show each CPU core’s usage separately2: Show only average CPU usagex: Highlight the sorted column-R: Reverse sort ordern [num]: Show only the topnumentries (0means no limit)l: Toggle display of CPU load infot: Toggle task and CPU detailsm: Toggle memory detailsc: Show full command lineV: Show commands in a tree formatH: Show threadsW: Save current interactive settings to~/.toprc, enabling consistent output when using non-interactive mode liketop -b -n 1
- Memory-related fields:
VIRT(virtual memory size): Total virtual memory used by the process, including code, data, shared libs, swapped pages, and mapped-but-unused pagesVIRT = SWAP + RES
SWAP: Amount of virtual memory swapped outRES: Non-swapped physical memoryRES = CODE + DATA
CODE(TRS): Physical memory used by the process codeDATA(DRS): Physical memory used by non-code (data and stack)SHR: Shared memory used
6.5 htop
htop provides very detailed interaction options on its interface
Install:
1 | # Install yum repo |
Examples:
htop
6.6 slabtop
slabtop is used to display information related to the kernel’s slab cache
Examples:
slabtop
6.7 sar
sar has a log rotation-like feature. It uses scheduled tasks defined in /etc/cron.d/sysstat to store logs under /var/log/sa/.
Install:
1 | yum install -y sysstat |
Pattern:
sar [ options ] [ <interval> [ <count> ] ]
Options:
-u: View CPU usage-q: View CPU load-r: View memory usage-b: View I/O and transfer rate information-d: View I/O status for each disk-B: View paging activity-f <filename>: Specify sa log file-P <cpu num>|ALL: View stats for a specific CPU,ALLmeans all CPUs-n [keyword]: View network-related info; keywords can be:DEV: Network interfacesEDEV: Network interface errorsSOCK: SocketsIP: IP trafficTCP: TCP trafficUDP: UDP traffic
-h: Output in human-readable format
Examples:
sar -u ALL 1: Output CPU info aggregated for all cores every secondsar -P ALL 1: Output CPU info per core every secondsar -r ALL -h 1: Output memory info every second in human-readable formsar -B 1: Output paging info every secondsar -n TCP,UDP -h 1: View TCP/UDP summary every secondsar -n DEV -h 1: View real-time network interface traffic every secondsar -b 1: View summary I/O info every secondsar -d -h 1: View per-disk I/O info every second
6.8 tsar
Pattern:
tsar [-l]
Options:
-l: View real-time data
Examples:
tsar -l
6.9 vmstat
Pattern:
vmstat [options] [delay [count]]
Options:
-a, --active: Show active and inactive memory-f, --forks: Number of forks since system start (in Linux, process creation uses the fork syscall)- Info is retrieved from the
processesfield in/proc/stat
- Info is retrieved from the
-m, --slabs: View system slab info-s, --stats: View detailed memory usage info-d, --disk: View detailed disk usage info-D, --disk-sum: Summarize disk statistics-p, --partition <dev>: View detailed info of specified partition-S, --unit <char>: Specify output unit, supports onlyk/Kandm/M, default isK-w, --wide: Output more detailed info-t, --timestamp: Output timestampsdelay: Sampling intervalcount: Sampling count
Output Details:
processr: Number of running processes (inrunningorwaitingstate)b: Number of blocked processes
memoryswpd: Total virtual memoryfree: Total free memorybuff: Total memory used as Buffercache: Total memory used as Cacheinact: Total inactive memory (requires-aoption)active: Total active memory (requires-aoption)
swapsi: Amount of memory swapped in from disk per secondso: Amount of memory swapped out to disk per second
iobi: Blocks received from block device per secondbo: Blocks sent to block device per second
systemin: Number of interrupts per second, including clock interruptscs: Number of context switches per second
cpuus: User CPU timesy: System (kernel) CPU timeid: Idle CPU timewa: CPU time waiting for IOst: Time stolen from a virtual machine
Examples:
vmstatvmstat 2vmstat 2 5vmstat -svmstat -s -S mvmstat -fvmstat -dvmstat -p /dev/sda1vmstat -m
6.10 mpstat
mpstat (multiprocessor statistics) is a real-time monitoring tool that reports various statistics related to the CPU. These statistics are stored in the /proc/stat file. On multi-CPU systems, mpstat not only provides information about the average status of all CPUs but also allows you to view statistics for specific CPUs. The greatest feature of mpstat is its ability to display statistical data for each individual computing core in multi-core CPUs. In contrast, similar tools like vmstat can only provide overall CPU statistics for the entire system.
Output Details:
%usr: Show the percentage of CPU utilization that occurred while executing at the user level (application).%nice: Show the percentage of CPU utilization that occurred while executing at the user level with nice priority.%sys: Show the percentage of CPU utilization that occurred while executing at the system level (kernel). Note that this does not include time spent servicing hardware and software interrupts.%iowait: Show the percentage of time that the CPU or CPUs were idle during which the system had an outstanding disk I/O request.%irq: Show the percentage of time spent by the CPU or CPUs to service hardware interrupts.%soft: Show the percentage of time spent by the CPU or CPUs to service software interrupts.%steal: Show the percentage of time spent in involuntary wait by the virtual CPU or CPUs while the hypervisor was servicing another virtual processor.%guest: Show the percentage of time spent by the CPU or CPUs to run a virtual processor.%gnice: Show the percentage of time spent by the CPU or CPUs to run a niced guest.%idle: Show the percentage of time that the CPU or CPUs were idle and the system did not have an outstanding disk I/O request.
Examples:
mpstat 2 5mpstat -P ALL 2 5mpstat -P 0,2,4-7 1
6.11 iostat
Pattern:
iostat [ -c | -d ] [ -k | -m ] [ -t ] [ -x ] [ interval [ count ] ]
Options:
-c: Mutually exclusive with-d, shows only CPU-related information-d: Mutually exclusive with-c, shows only disk-related information-k: Display I/O rate in kB (default isBlk, the filesystem block)-m: Display I/O rate in MB (default isBlk, the filesystem block)-t: Print date information-x: Print extended information-z: Omit devices with no events during samplinginterval: Print intervalcount: Number of times to print; if omitted, print continuously
Output Details:(man iostat)
cpu: Search forCPU Utilization Reportin man pagedevice: Search forDevice Utilization Reportin man page
Examples:
iostat -dtx 1iostat -dtx 1 sdaiostat -tx 3
6.12 dstat
dstat is a versatile tool for generating system resource statistics.
Pattern:
dstat [options]
Options:
-c, --cpu:CPUstatisticsusr(user)sys(system)idl(idle)wai(wait)hiq(hardware interrupt)siq(software interrupt)
-d, --disk: Disk statisticsreadwrit(write)
-i, --int: Interrupt statistics-l, --load:CPUload statistics1 min5 mins15mins
-m, --mem: Memory statisticsusedbuff(buffers)cach(cache)free
-n, --net: Network statisticsrecv(receive)send
-p, --proc: Process statisticsrun(runnable)blk(uninterruptible)new
-r, --io: I/O statisticsread(read requests)writ(write requests)
-s, --swap: Swap statisticsusedfree
-t, --time: Time information-v, --vmstat: Equivalent todstat -pmgdsc -D total, similar tovmstatoutput--vm: Virtual memory related informationmajpf(hard pagefaults)minpf(soft pagefaults)allocfree
-y, --sys: System statisticsint(interrupts)csw(context switches)
--fs, --filesystem: Filesystem statisticsfiles(open files)inodes
--ipc: IPC statisticsmsg(message queue)sem(semaphores)shm(shared memory)
--lock: File lock statisticspos(posix)lck(flock)rea(read)wri(write)
--socket: Socket statisticstot(total)tcpudprawfrg(ip-fragments)
--tcp: TCP statistics, includinglis(listen)act(established)syntim(time_wait)clo(close)
--udp: UDP statistics, includinglis(listen)act(active)
-f, --full: Show details, for exampleCPUshown per CPU, network shown per network card--top-cpu: Show processes consuming the mostCPUresources--top-cpu-adv: Show processes consuming the mostCPUresources, with additional process information (advanced)--top-io: Show processes consuming the mostIOresources--top-io-adv: Show processes consuming the mostIOresources, with additional process information (advanced)--top-mem: Show processes consuming the most memory resources
Examples:
dstat 5 10: Refresh every 5 seconds, 10 timesdstat -tvlndstat -tcdstat -tc -C total,1,2,3,4,5,6dstat -tddstat -td -D total,sda,sdbdstat -td --disk-utildstat -tndstat -tn -N total,eth0,eth2
6.13 ifstat
This command is used to view the network interface card’s traffic status, including successfully received/sent packets as well as error received/sent packets. What you see is basically similar to ifconfig.
6.14 pidstat
pidstat is a command from the sysstat toolset, used to monitor system resource usage of all or specified processes, including CPU, memory, threads, device I/O, and more. When run for the first time, pidstat displays statistics since the system startup; subsequent runs show statistics since the last time the command was executed. Users can specify the number of samples and the interval to obtain the desired statistics.
Pattern:
dstat [options] [ interval [ count ] ]
Options:
-d: DisplayI/OusagekB_rd/s: Disk read rate inKBkB_wr/s: Disk write rate inKBkB_ccwr/s: Write rate inKBthat was supposed to be done but canceled. This may be triggered when tasks discarddirty pagecachedue to canceling
-r: Display memory usageminflt/s:minor faults per secondmajflt/s:major faults per second
-s: Display stack usageStkSize: Stack size reserved by the system for the task, inKBStkRef: Current actual stack usage by the task, inKB
-u: DisplayCPUusage (default)-I: InSMP, Symmetric Multi-Processingenvironments, theCPUusage needs to consider the number of processors for the%CPUmetric to be accurate- The
%usr,%system,%guestmetrics will not exceed 100% whether or not-Iis used, see pidstat do not report %usr %system correctly in SMP environment
-w: Display context switches explicitly (does not include threads, usually used with-t)-t: Display all threads explicitly-p <pid>: Specify process
Examples:
pidstat -d -p <pid> 5pidstat -r -p <pid> 5pidstat -s -p <pid> 5pidstat -uI -p <pid> 5pidstat -ut -p <pid> 5pidstat -wt -p <pid> 5
6.15 nethogs
nethogs lists each process with the network interface and bandwidth it occupies, shown on a per-process basis.
Install:
1 | # Install yum repo |
Examples:
nethogs
6.16 iptraf
6.17 iftop
iftop lists the incoming and outgoing traffic for each connection, shown on a per-connection basis.
Install:
1 | # Install yum repo |
Examples:
iftop
6.18 iotop
Install:
1 | # Install yum repo |
Options:
-o: Only display processes or threads currently performing I/O operations-u: Followed by a username-P: Display processes only, not threads-b: Batch mode, i.e., non-interactive mode-n: Followed by the number of iterations
Examples:
iotopiotop -oPiotop -oP -b -n 10iotop -u admin
6.19 blktrace
Introduction to the IO tool blktrace
The handling process of an I/O request can be summarized with this simple diagram:
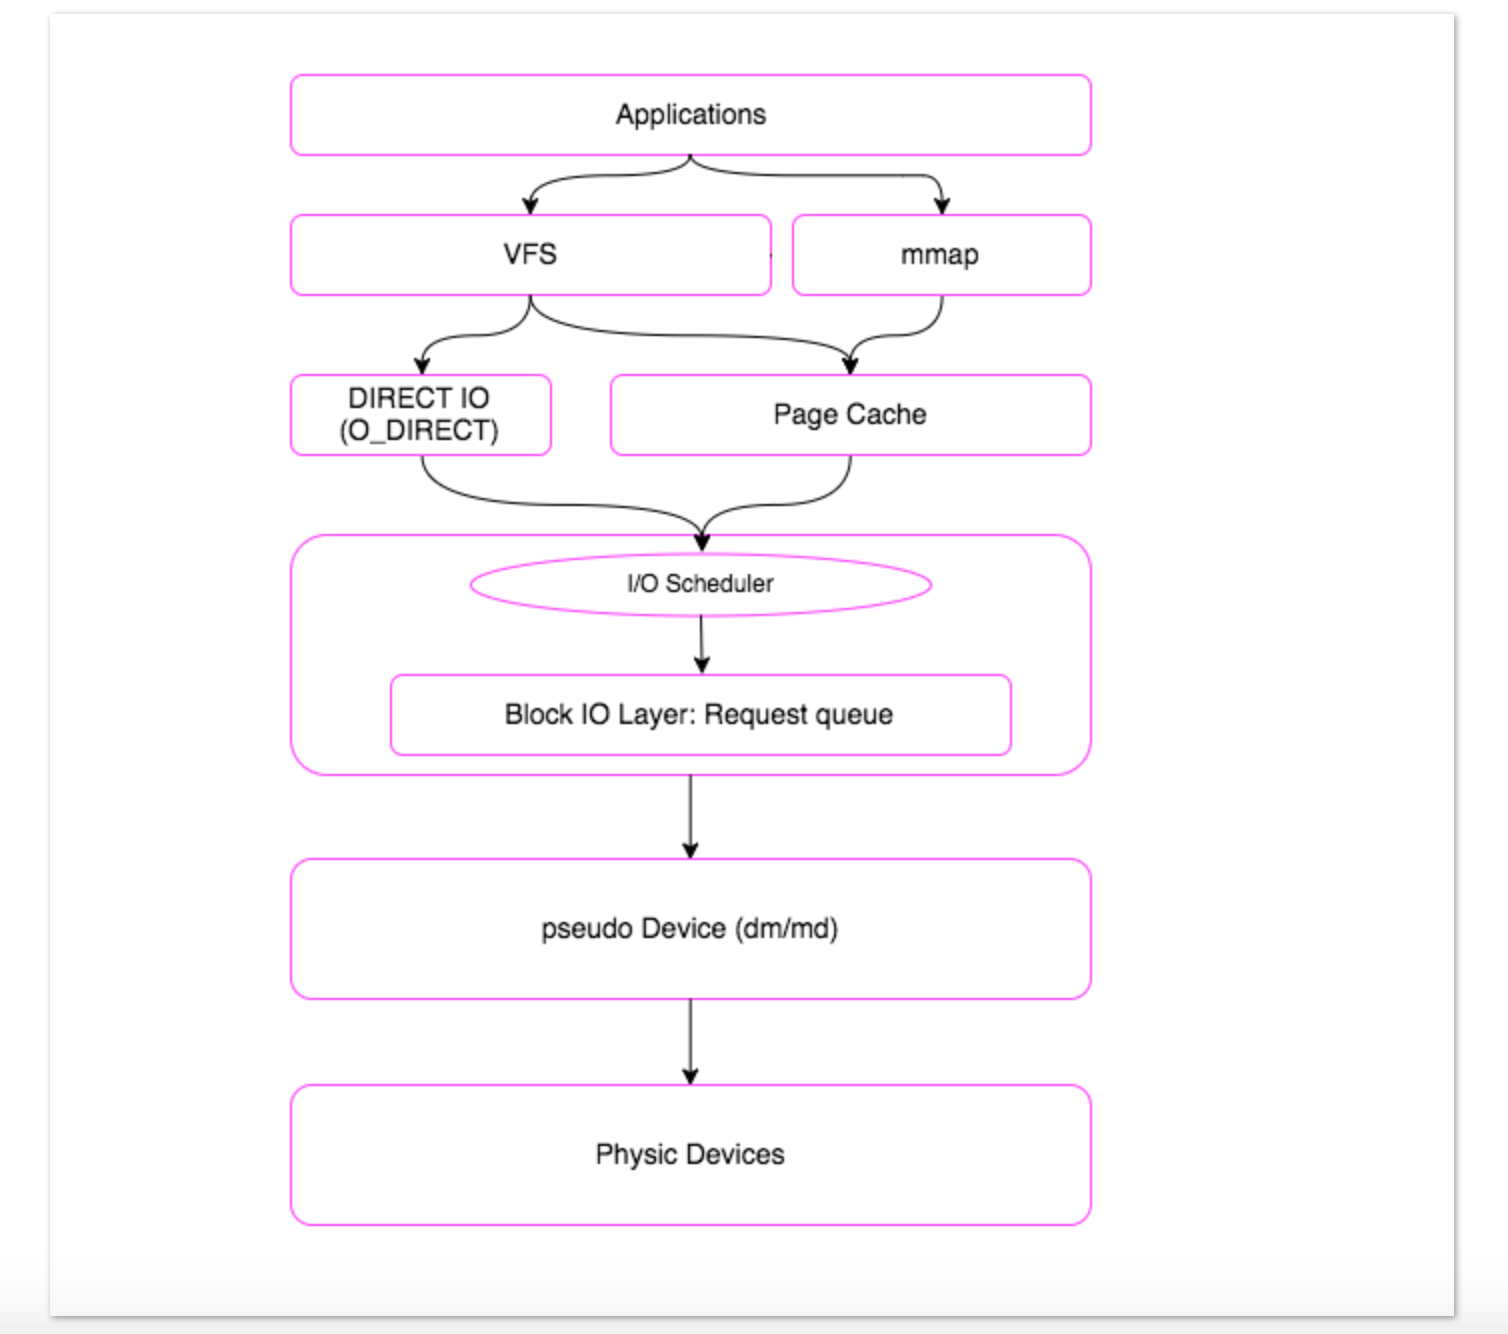
blktrace is used to collect I/O data. The collected data generally cannot be analyzed directly and usually needs to be processed with some analysis tools, including:
blkparsebttblkiomoniowatcher
Before using blktrace, it is necessary to mount debugfs:
1 | mount –t debugfs debugfs /sys/kernel/debug |
blkparse output parameter explanation:
-
8,0 0 21311 3.618501874 5099 Q WFSM 101872094 + 2 [kworker/0:2] -
First parameter:
8,0, represents the device numbermajor device IDandminor device ID -
Second field:
0, represents theCPU -
Third field:
21311, represents the sequence number -
Fourth field:
3.618501874, represents the time offset -
Fifth field:
5099, represents thepidof thisI/Ooperation -
Sixth field:
Q, represents theI/O Event. This field is very important as it reflects the current stage of theI/Ooperation:1
2
3
4
5
6
7
8
9Q – I/O request about to be generated
|
G – I/O request generated
|
I – I/O request entered IO Scheduler queue
|
D – I/O request entered driver
|
C – I/O request completed -
Seventh field:
WFSM -
Eighth field:
101872094 + 2, represents the startingblock numberandnumber of blocks, i.e., the commonly referredOffsetandSize -
Ninth field:
[kworker/0:2], represents the process name
Examples:
-
Collect first, then analyze
1
2
3
4
5
6# This command generates a cluster of sda.blktrace.<cpu> files in the current directory
# Press Ctrl + C to stop collection
blktrace -d /dev/sda
# Analyze the sda.blktrace.<cpu> file cluster and output the analysis results
blkparse sda -
Collect and analyze simultaneously
1
2
3# The standard output of blktrace is piped directly to the standard input of blkparse
# Press Ctrl + C to stop collection
blktrace -d /dev/sda -o - | blkparse -i - -
Analyze using
btt1
2
3
4
5
6
7blktrace -d /dev/sda
# This command merges the sda.blktrace.<cpu> file cluster into a single file sda.blktrace.bin
blkparse -i sda -d sda.blktrace.bin
# This command analyzes sda.blktrace.bin and outputs the analysis results
btt -i sda.blktrace.bin -l sda.d2c_latency
6.20 lsof
lsof is used to list open files, including socket files.
Options:
-U: selects the listing of UNIX domain socket files-i <address>: selects the listing of files any of whose Internet address matches the address specified. Address format:[46][protocol][@hostname|hostaddr][:service|port]46: ipv4/ipv6protocol: tcp/udphostnamehostaddrservice: likesmtpport
-p <expr>: excludes or selects the listing of files for the processes whose optional process IDentification (PID) numbers are in the comma-separated set - e.g.,123or123,^456+|-w: Enables (+) or disables (-) the suppression of warning messages
Examples:
lsof -n | awk '{print $2}' | sort | uniq -c | sort -nr -k 1: View the number of file handles opened by the processlsof -i 6tcp@localhost:22lsof -i 4tcp@127.0.0.1:22lsof -i tcp@127.0.0.1:22lsof -i tcp@localhostlsof -i tcp:22lsof -i :22lsof -U -w | grep docker.sock
6.21 fuser
fuser is used to identify processes using files or sockets.
Options:
-n <NAMESPACE>: Select a different name space. The name spacesfile(file names, the default),udp(local UDP ports), andtcp(local TCP ports) are supported. For ports, either the port number or the symbolic name can be specified. If there is no ambiguity, the shortcut notationname/space(e.g.,80/tcp) can be usedfuser /tmp/a.txtequals tofuser -n file /tmp/a.txtfuser -n tcp 7061equals tofuser 7061/tcp
-m <NAME>:NAMEspecifies a file on a mounted file system or a block device that is mounted. All processes accessing files on that file system are listed-k: Kill processes accessing the file. Unless changed with-SIGNAL,SIGKILLis sent-u: Append the user name of the process owner to each PID-v: Verbose mode
Examples:
fuser -uv /tmp/a.txtfuser -m /tmp -uvfuser -uv 80/tcpfuser -k /tmp/a.txtfuser -k 80/tcp
7 Performance Analysis
7.1 strace
strace is a powerful diagnostic, debugging, and instructional tool for Linux and other Unix-like operating systems. It’s used primarily to trace system calls made by a process and the signals received by the process. The name strace stands for “system call trace.”
Key aspects of strace include:
- Tracing System Calls: strace displays a list of system calls made by a program as it runs. This includes calls for opening files, reading/writing data, allocating memory, and interacting with the kernel.
- Signals and Interrupts: It also monitors the signals received by the process, which can be crucial in debugging issues related to signal handling.
- Output Details: For each system call, strace shows the call name, passed arguments, returned value, and error code (if any). This information is invaluable for understanding what a program is doing at a system level.
- Usage for Debugging: It’s widely used for debugging applications during development. By examining system call traces, developers can identify if a program is behaving unexpectedly or inefficiently.
- Performance Analysis: strace can help in identifying performance bottlenecks by highlighting frequent or time-consuming system calls.
- Security Analysis: In security, it’s used to analyze how an application interacts with the system, which can reveal potential security flaws or unauthorized actions.
- Learning Tool: For those learning about operating systems and programming, strace offers a practical way to understand the interaction between software and the Linux kernel.
Options:
-p [PID]: This option is used to attach strace to an already running process.-f: Traces not only the main process but also all the forked child processes.-e trace=[system calls]: This option allows you to filter the trace to only specific system calls.-e trace=memory: Filters the trace to only show system calls related to memory-related system calls.-e trace=desc: Filters the trace to only show system calls related to file descriptor-related system calls.-e trace=file: Filters the trace to only show system calls related to file-related system calls.-e trace=network: Filters the trace to only show system calls related to network-related system calls.-e trace=signal: Filters the trace to only show system calls related to signal-related system calls.-e trace=process: Filters the trace to only show system calls related to process-related system calls.-e trace=ipc: Filters the trace to only show system calls related to inter-process communication-related system calls.
-c: Rather than showing every system call, this option provides a summary upon completion.
Examples:
strace cat /etc/fstabstrace -e trace=read cat /etc/fstabstrace -e trace=memory -c cat /etc/fstabstrace -e trace=network -c curl www.baidu.comstrace -c cat /etc/fstabtimeout 10 strace -p {PID} -f -c
7.2 perf
The principle of perf is as follows: every fixed interval, an interrupt is generated on the CPU (on each core). During the interrupt, it checks the current pid and function, then adds a count to the corresponding pid and function. In this way, we know what percentage of CPU time is spent on a certain pid or function.
Common Subcommands:
archive: Since parsingperf.datarequires additional information, such as symbol tables,pid, and process relationships, this command packages all relevant files together, enabling analysis on other machines.diff: Displays the differences between twoperf.datafiles.evlist: Lists the events contained inperf.data.list: Shows all supported events.record: Starts analysis and writes records toperf.data.perf recordgenerates aperf.datafile in the current directory (if this file already exists, the old file is renamed toperf.data.old).perf recordis not necessarily used to track processes it starts itself. By specifyingpid, it can directly track a fixed group of processes. Also, as you may have noticed, the tracking given above only monitors events occurring in a specific pid. However, in many scenarios, like aWebServer, you may be concerned with the entire system’s performance, as the network might take up part of theCPU, theWebServeritself uses someCPU, and the storage subsystem also occupies part of theCPU. The network and storage don’t necessarily belong to your WebServer’spid. Therefore, for full-system tuning, we often add the-aparameter to theperf recordcommand, allowing us to track the performance of the entire system.
report: Reads and displaysperf.data.stat: Only shows some statistical information.top: Analyzes in an interactive mode.?: help doc
lock: Used for analyzing and profiling lock contention in multi-threaded applications or the kernel.
Key Parameters:
-e: Specifies the event to trackperf top -e branch-misses,cyclesperf top -e branch-misses:u,cycles: The event can have a suffix, tracking only branch prediction failures occurring in user mode.perf top -e '{branch-misses,cycles}:u': All events focus only on the user mode portion.perf stat -e "syscalls:sys_enter_*" ls: All system calls.
-s: Specifies the parameter to categorize byperf top -e 'cycles' -s comm,pid,dso
-p: Specifies thepidto track
Frequently Used Events:
cycles/cpu-cycles & instructionsbranch-instructions & branch-missescache-references & cache-missescache-missesindicates the number of times access to main memory is required due to a miss in all cache levels. Cases likeL1-miss, L2-hitare not included.- What are perf cache events meaning?
- How does Linux perf calculate the cache-references and cache-misses events
LLC, last level cache:LLC-loads & LLC-load-missesLLC-stores & LLC-store-misses
L1:L1-dcache-loads & L1-dcache-load-missesL1-dcache-storesL1-icache-load-missesmem_load_retired.l1_hit & mem_load_retired.l1_miss
L2:mem_load_retired.l2_hit & mem_load_retired.l2_miss
L3:mem_load_retired.l3_hit & mem_load_retired.l3_miss
context-switches & sched:sched_switchpage-faults & major-faults & minor-faultsblockblock:block_rq_issue: This event is triggered by issuing adevice I/O request.rqis short forrequest.
kmemkmem:kmallockmem:kfree
Examples:
perf list: View all supported events.perf stat -e L1-dcache-load-misses,L1-dcache-loads -- cat /etc/passwd: Calculate cache miss rate.timeout 10 perf record -e 'cycles' -a: Record statistics for the entire system for 10 seconds.perf record -e 'cycles' -p xxx: Record statistics for a specified process.perf record -e 'cycles' -- myapplication arg1 arg2: Start an application and record statistics.perf report: View the analysis report.perf lock record -p <pid>; perf lock reportperf top -p <pid> -g: Interactively analyze the performance of a program (a powerful tool)-gshows the percentage of a function itself and its children. Each item can be expanded to show the parent stack, child stack, or both, depending on the specific case.- Selecting an entry and choosing
Annotate xxxallows viewing the corresponding assembly code.
perf stat -p <pid> -e branch-instructions,branch-misses,cache-misses,cache-references,cpu-cycles,ref-cycles,instructions,mem_load_retired.l1_hit,mem_load_retired.l1_miss,mem_load_retired.l2_hit,mem_load_retired.l2_miss,cpu-migrations,context-switches,page-faults,major-faults,minor-faults- This command outputs a percentage on the right side, representing the ratio of the time
perfspends on the specifiedeventcompared to the total timeperfrecords.
- This command outputs a percentage on the right side, representing the ratio of the time
perf stat -p <pid> -e "syscalls:sys_enter_*": Focus on system calls.
8 Remote Desktop
X Window System, X11, X is a graphical display system. It consists of two components: X Server
X Server: Must run on a host with graphical display capabilities. It manages the display-related hardware settings on the host (such as graphics card, hard drive, mouse, etc.). It is responsible for drawing and displaying the screen content, and notifying theX Clientof input actions (such as keyboard and mouse).- Implementations of
X Serverinclude:XFree86Xorg: A derivative ofXFree86. This is theX Serverrunning on most Linux systems.Accelerated X: Developed by theAccelerated X Product, with improvements in accelerated graphical display.X Server suSE: Developed by theSuSE Team.Xquartz: TheX Serverrunning onMacOSsystems.
- Implementations of
X Client: The core part of applications, hardware-independent. Each application is anX Client. AnX Clientcan be a terminal emulator (Xterm) or a graphical interface program. It does not directly draw or manipulate graphics on the display but communicates with theX Server, which controls the display.X ServerandX Clientcan be on the same machine or different machines. They communicate viaxlib.
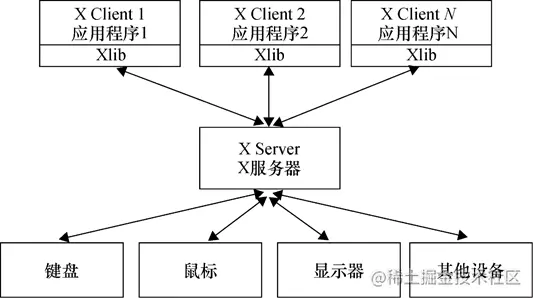
8.1 xquartz (Not Recommended)
Working principle: A pure X Window System solution, where xquartz is one implementation of the X Server.

How to use:
- Install
Xquartzon the local computer (takingMacas an example) - Install
xauthon the remote Linux host and enableX11 Forwardinginsshdyum install -y xauth- Set
X11Forwarding yesin/etc/ssh/sshd_config
- Use
sshwithX11 Forwardingfrom the local computer to connect to the remote Linux hostssh -Y user@target
- In the remote ssh session, run the
X Clientprogram, e.g.,xclock
Disadvantages: Consumes a large amount of bandwidth, and only one X Client program can run per ssh session.
8.2 VNC (Recommended)
Virtual Network Computing, VNC. It mainly consists of two parts: VNC Server and VNC Viewer.
VNC Server: RunsXvnc(an implementation ofX Server), butXvncdoes not directly control display-related hardware. Instead, it communicates with theVNC Viewervia theVNC Protocoland controls the display-related hardware on the host where theVNC Vieweris running. A host can run multipleXvncinstances, each listening locally on a port (590x).VNC Client: Connects to the port exposed by theVNC Serverto obtain the graphical output information (including transmitting I/O device signals).

How to use:
- Install
VNC Serveron Linux: example with CentOSyum install -y tigervnc-servervncserver :x— start service on port5900 + xvncserver -kill :x— stop service on port5900 + xvncserver -list— show all runningXvncinstances
- Download
VNC Viewerfrom official website- By default, you can log in with your Linux username and password
Tips:
vncserver -SecurityTypes None :x— allow passwordless login- Keyboard input issues: hold
ctrl + shift, then open the terminal - Running
vncconfig -display :xin the remote desktop terminal pops up a small window for configuring options - How to copy and paste between Mac and remote Linux, see copy paste between mac and remote desktop
Remote Linux -> Mac:- In
VNC Viewer, select text and pressCtrl + Shift + C(sometimes just selecting the text is enough) - On Mac, paste with
Command + V
- In
Mac -> Remote Linux(often fails for unknown reasons):- On Mac, select text and press
Command + C - In
VNC Viewer, paste withCtrl + Shift + V
- On Mac, select text and press
Remote Linux -> Remote Linux:- In
VNC Viewer, select text and pressCtrl + Shift + C - In
VNC Viewer, paste withCtrl + Shift + V
- In
8.3 NX (Recommended)
Working principle: Similar to VNC, but uses the NX protocol, which consumes less bandwidth.
How to use:
- Install
NX Serveron Linux: example with CentOS, download the rpm package and installrpm -ivh nomachine_7.7.4_1_x86_64.rpm/etc/NX/nxserver --restart
- Download
NX Clientfrom the official website- The default port for
NX Serveris4000 - You can log in with your Linux username and password by default
- The default port for
Configuration file: /usr/NX/etc/server.cfg
NXPort: Modify the startup port numberEnableUserDB/EnablePasswordDB: Whether to use an additional user database for login (1 to enable, 0 to disable, default is disabled)/etc/NX/nxserver --useradd admin --system --administrator: This command essentially creates a Linux account; the first password is for the Linux account, and the second password is an independent password forNX Server(used only forNXlogin)
9 audit
9.1 Architecture
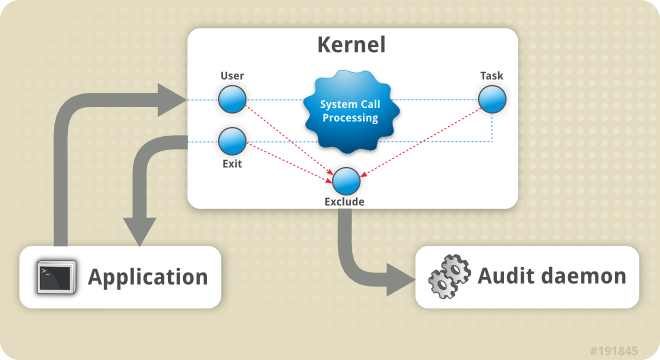
The audit system consists of two main parts: user-space applications and utilities, and kernel-side system call handling. The kernel component accepts system calls from user-space applications and filters them through one of three filters: user, task, or exit. Once a system call passes through one of these filters, it is further processed by the exclude filter based on audit rule configuration, then passed to the audit daemon for further handling.
The processing is similar to iptables, with rule chains where rules can be added. When a syscall or special event is detected, the chain is traversed and processed according to the rules, producing different logs.
Kernel compile options related to audit
1 | CONFIG_AUDIT_ARCH=y |
As long as the audit option is enabled during kernel compilation, the kernel will generate audit events and send them to a socket. The audit daemon (auditd) is responsible for reading audit events from this socket and recording them.
9.2 auditctl
9.2.1 Control Rules
Options:
-b: Set the maximum allowed number of unfinished audit buffers, default is64-e [0..2]: Set the enable flag0: Disable audit functionality1: Enable audit functionality and allow configuration changes2: Enable audit functionality and disallow configuration changes
-f [0..2]: Set the failure flag (how to handle exceptions)0: silent, do nothing on exceptions (silent mode)1: printk, log the event (default)2: panic, crash the system
-r: Message generation rate, in seconds-s: Report audit system status-l: List all currently loaded audit rules-D: Delete all rules and watches
Examples:
auditctl -b 8192auditctl -e 0auditctl -r 0auditctl -sauditctl -l
9.2.2 File System Rules
Pattern:
auditctl -w <path_to_file> -p <permissions> -k <key_name>
Options:
-w: Path name-p: Followed by permissions, includingr: Read file or directoryw: Write file or directoryx: Execute file or directorya: Change attributes in file or directory
-k: Followed by a string, can be arbitrarily specified, used for searching
Examples:
auditctl -w /etc/shadow -p wa -k passwd_changes: Equals toauditctl -a always,exit -F path=/etc/shadow -F perm=wa -k passwd_changes
9.2.3 System Call Rules
Pattern:
auditctl -a <action>,<filter> -S <system_call> -F field=value -k <key_name>
Options:
-a: Followed byactionandfilteraction: Determines whether to record audit events matching thefilter, options includealways: recordnever: do not record
filter: audit event filter, options includetask: matches audit events generated when processes are created (forkorclone)exit: matches audit events generated at the end of system callsuser: matches audit events from user spaceexclude: used to mask unwanted audit events
-S: Followed by system call names; the list of system calls can be found in/usr/include/asm/unistd_64.h. To specify multiple system calls, use multiple-Soptions, each specifying one system call.-F: Extended option, key-value pair-k: Followed by a string, can be arbitrarily specified, used for searching
Examples:
auditctl -a always,exit -F arch=b64 -S adjtimex -S settimeofday -k time_change
9.3 ausearch
Options:
-i: Translate the results to make them more readable-m: Specify the type-sc: Specify the system call name-sv: Whether the system call was successful
Examples:
ausearch -i: Search all eventsausearch --message USER_LOGIN --success no --interpret: Search for events related to failed loginsausearch -m ADD_USER -m DEL_USER -m ADD_GROUP -m USER_CHAUTHTOK -m DEL_GROUP -m CHGRP_ID -m ROLE_ASSIGN -m ROLE_REMOVE -i: Search for all events related to account, group, and role changesausearch --start yesterday --end now -m SYSCALL -sv no -i: Search for all failed system call events from yesterday until nowausearch -m SYSCALL -sc open -i: Search for events related to the system call “open”
9.4 Audit Record Types
10 Package Management Tools
10.1 rpm
Examples:
rpm -qa | grep openjdkrpm -ql java-11-openjdk-devel-11.0.8.10-1.el7.x86_64: View the software installation path
10.2 yum
Source Management (/etc/yum.repos.d):
yum repolistyum-config-manager --enable <repo>yum-config-manager --disable <repo>yum-config-manager --add-repo <repo_url>
Install and Uninstall:
yum install <software>yum remove <software>yum localinstall <rpms>
Cache:
yum makecacheyum makecache fast: Ensure the cache only contains the latest information, equivalent toyum clean expire-cache
yum clean: Clear the cacheyum clean expire-cache: Clear expired cacheyum clean all: Clear all caches
Software List:
yum list: List all installable softwareyum list docker-ce --showduplicates | sort -r: Query version information of the software
Install jdk:
1 | sudo yum install java-1.8.0-openjdk-devel |
10.2.1 scl
SCL stands for Software Collections. It’s a mechanism that allows you to install multiple versions of software on the same system, without them conflicting with each other. This is especially helpful for software like databases, web servers, or development tools where you might need different versions for different projects.
Examples:
scl -l: Lists all the available software collections on your system.scl enable <collection> <command>: This command runs a specified<command>within the environment of the given software<collection>. This means that when you run a command under a specific software collection, you’re using the version of the software provided by that collection.
Install a specific version of gcc:
1 | yum -y install centos-release-scl |
Delete:
1 | yum -y remove devtoolset-7\* |
10.3 dnf
Examples:
dnf provides /usr/lib/grub/x86_64-efi
10.4 apt
Examples:
1 | add-apt-repository "deb https://apt.llvm.org/your-ubuntu-version/ llvm-toolchain-your-ubuntu-version main" |
11 FAQ
11.1 System Information
11.1.1 Basic
11.1.1.1 Determine physical/virtual machine
systemd-detect-virt
11.1.1.2 Get Ip Address
ip -4 addr show scope global | grep inet | awk '{print $2}' | cut -d/ -f1
11.1.2 Disk & Filesystem
11.1.2.1 Determine disk type
lsblk -d --output NAME,ROTAROTA: 0: SSDROTA: 1: HDD
cat /sys/block/<device_name>/queue/rotational<device_name>may be sda
11.1.2.2 Get inode related information
df -ils -istat <file_path>find <path> -inum <inode_number>tune2fs -l /dev/sda1 | grep -i 'inode'
11.2 System Monitoring
11.2.1 Real-time Dashboard
dstat -tvln
11.2.1.1 CPU
dstat -tcdstat -tc -C total,1,2,3,4,5,6mpstat 1mpstat -P ALL 1mpstat -P 0,2,4-7 1sar -u ALL 1sar -P ALL 1
11.2.1.2 Memory
dstat -tm --vm --page --swapsar -r ALL -h 1
11.2.1.3 I/O
dstat -tddstat -td -D total,sda,sdbiostat -dtx 1sar -b 1sar -d -h 1
11.2.1.4 Network
dstat -tndstat -tn -N total,eth0,eth2sar -n TCP,UDP -h 1sar -n DEV -h 1
11.2.1.5 Analysis
CPU:
large %nice: In system monitoring, the%nicemetric indicates the percentage of CPU time spent executing processes that have had their priority adjusted using the nice command. A high%nicevalue generally means that there are many low-priority tasks running. These tasks have been set to a lower priority to minimize their impact on other higher-priority taskslarge %iowait: indicates that a significant amount of CPU time is being spent waiting for I/O (Input/Output) operations to complete. This is a measure of how much time the CPU is idle while waiting for data transfer to and from storage devices such as hard disks, SSDs, or network file systems. High%iowaitcan be a sign of several underlying issues or conditions:- Disk Bottlenecks
- High I/O Demand
- Insufficient Disk Bandwidth
- Disk Fragmentation
- Network Storage Latency
- Hardware Issues
large %steal:%stealvalue in system monitoring refers to the percentage of CPU time that the virtual machine (VM) was ready to run but had to wait because the hypervisor was servicing another virtual CPU (vCPU) on the physical host. This is a specific metric in virtualized environments and is typically indicative of resource contention on the physical host. Here are some key points and possible reasons for a high%stealvalue:- Overcommitted Host Resources
- High Load on Other VMs
- Inadequate Host Capacity
- Suboptimal Resource Allocation
large %irq: indicates that a significant portion of the CPU’s time is being spent handling hardware interrupts. Interrupts are signals sent to the CPU by hardware devices (like network cards, disk controllers, and other peripherals) to indicate that they need processing. While handling interrupts is a normal part of system operation, an unusually high%irqcan indicate potential issues or inefficiencies:- High Network Traffic
- High Disk I/O
- Faulty Hardware
- Driver Issues
- Interrupt Storms
large %soft: indicates that a significant portion of the CPU’s time is being spent handling software interrupts, which are used in many operating systems to handle tasks that require timely processing but can be deferred for a short period. Softirqs are typically used for networking, disk I/O, and other system-level tasks that are not as critical as hardware interrupts but still need prompt attention- High Network Traffic
- High Disk I/O
- Interrupt Coalescing
Memory:
large majpf: indicates that the system is experiencing a lot of disk I/O due to pages being read from disk into memory. This can be a sign of insufficient physical memory (RAM) for the workload being handled, leading to the following scenarios:- Memory Overcommitment
- Heavy Memory Usage
- Insufficient RAM
large minpf: indicates that the system is frequently accessing pages that are not in the process’s working set but are still in physical memory. While minor page faults are less costly than major page faults because they do not require disk I/O, a large number of them can still have performance implications. Here are some reasons and implications for a high number of minor page faults:- Frequent Context Switching
- Large Working Sets
- Memory-Mapped Files
- Shared Libraries
11.2.2 Process
11.2.2.1 Find process with most CPU consumption
dstat --top-cpu-advps aux --sort=-%cpu | head -n 10ps -eo pid,comm,%cpu --sort=-%cpu | head -n 10
11.2.2.2 Find process with most Memory consumption
dstat --top-memps aux --sort=-%mem | head -n 10ps -eo pid,comm,%mem --sort=-%mem | head -n 10
11.2.2.3 Find process with most I/O consumption
dstat --top-bio-advdstat --top-io-adviotop -oP
11.2.2.4 Find process with most brand consumption
nethogs
11.2.2.5 Find process listening on specific port
lsof -n -i :80fuser -uv 80/tcpss -npl | grep 80
11.2.2.6 Find process using specific file
lsof /opt/config/xxxfuser -uv /opt/config/xxx
11.2.2.7 Get full command of a process
lsof -p xxx | grep txt
11.2.2.8 Get start time of a process
ps -p xxx -o lstart
11.2.3 Network
11.2.3.1 Find connection with most brand consumption
iftop
11.2.3.2 Get start time of a tcp connection
lsof -i :<port>: Get pid and fdll /proc/<pid>/fd/<fd>: The create time of this file is the create time of corresponding connection
11.2.3.3 How to kill a tcp connection
tcpkill -9 -i any host 127.0.0.1 and port 22
11.2.3.4 How to kill tcp connections with specific state
ss --tcp state CLOSE-WAIT --kill
11.3 Assorted
11.3.1 Allow using docker command without sudo
sudo usermod -aG docker username
11.3.2 Check symbols of binary
nm -D xxx.soreadelf -s --wide xxx.so
11.3.3 List all commands start with xxx
compgen -c | grep -E '^xxx
11.3.4 How to check file’s modification time
ls --full-time <file>stat <file>date -r <file>
11.3.5 Get Random UUID
cat /proc/sys/kernel/random/uuid
11.4 Health Thresholds for Monitoring Metrics
CPU Usage: Less than70%.CPU Load: Less than<coreNum> * 0.7.Memory Usage: Less than50%.Disk Usage: Less than70%.iowait: Less than50ms.Threads: Less than10K.IOPS: Less than1K.inode: Less than50%.
12 Reference
- 《鸟哥的Linux私房菜》
- Linux Tools Quick Tutorial
- linux shell awk 流程控制语句(if,for,while,do)详细介绍
- awk 正则表达式、正则运算符详细介绍
- 解决Linux关闭终端(关闭SSH等)后运行的程序自动停止
- Linux ss命令详解
- Socat 入门教程
- Linux 流量控制工具 TC 详解
- docker networking namespace not visible in ip netns list
- Guide to IP Layer Network Administration with Linux
- Linux ip命令详解
- linux中路由策略rule和路由表table
- ip address scope parameter
- Displaying a routing table with ip route show
- What does “proto kernel” means in Unix Routing Table?
- Routing Tables
- How to execute a command in screen and detach?
- Linux使echo命令输出结果带颜色
- How to insert the content of a file into another file before a pattern (marker)?
- Insert contents of a file after specific pattern match
- How can I copy a hidden directory recursively and preserving its permissions?
- rm -rf all files and all hidden files without . & … error
- 通过tcpdump对Unix Domain Socket 进行抓包解析
- tcpdump 选项及过滤规则
- 如何知道进程运行在哪个 CPU 内核上?
- Don’t understand [0:0] iptable syntax
- Linux iptables drop日志记录
- Iptables 指南 1.1.19
- redhat-安全性指南-定义审核规则
- addr2line
- How to use OpenSSL to encrypt/decrypt files?
- confusion about mount options
- 在Linux下做性能分析3:perf
- tmux使用指南:比screen好用n倍!
- Perf: what do [
] records mean in perf stat output? - SSH隧道:端口转发功能详解
- X Window系统